Recommended resources
The freely available resources this lesson will direct you to.
Hello! Last time, we mapped an analysis from a business question through evidence, findings, and action. This lesson stays at the very beginning of that workflow: before you pull data, how do you decide what to measure?
You’ll turn a broad stakeholder request into a question that specifies a comparison, a population, and a time period—and still answers the decision the stakeholder needs to make. We’ll work through a storefront example, then draft a short request brief you could use in an analyst role. Allow about 40 minutes, including the guided practice.
Find the decision inside the request
Imagine a Shopify store manager messages you: “The new mobile free-shipping banner is hurting sales. Should we remove it before the next campaign?”
There are two things to notice. “Hurting sales” is not yet a measurement: it could refer to fewer orders, lower revenue, or a smaller share of visitors buying. And “the banner is hurting” is an explanation, not an established fact. The decision, however, is clear enough to investigate: whether to keep or remove the banner before a campaign.
A useful first response is not “I’ll send a sales chart.” It is: “What change prompted the concern, what decision must you make, and when? If orders are down but the share of visitors buying is steady, would that change your decision?” That last question tests whether the proposed evidence will actually be useful.
Vague Stakeholder Requests: A Framework for Analytics
Read this KISSmetrics article for its practical approach to uncovering a decision and confirming the scope of an analytics request.
In “The Question Behind the Question,” read the opening explanation. Then, under “5-Step Translation Framework,” read from “Step 1: Listen and Reflect” through “Step 5: Confirm in Writing”: the five steps. Focus on the questions you would ask aloud and what you would confirm in writing; you do not need the later section on building a team-wide intake process.
The stakeholder’s wording deserves attention, but it does not dictate the analysis. “Give me insights” might mean a quick decision is due, or it might be genuinely exploratory. Asking what the person would do differently depending on the result helps distinguish the two without guessing their intent.
Move from concern to measurable comparison
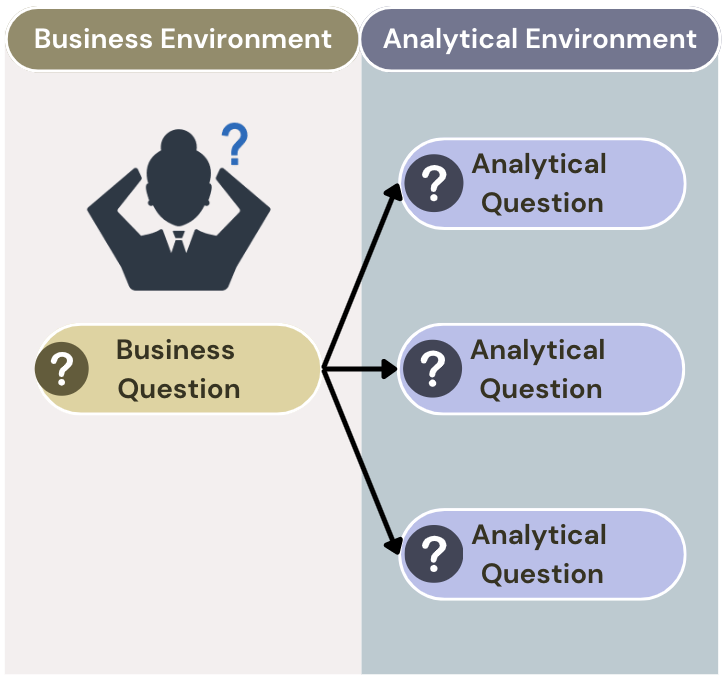
A business concern can generate several analytical questions. For the banner, you might examine total mobile orders, revenue, or how often a product-page visit ends in a purchase. These are related, but they do not answer exactly the same thing. Choose a primary question that bears on the decision, then identify any supporting checks.
The following video distinguishes broad or leading questions from questions that are specific, measurable, relevant, and time-bound. Notice that a measurable question need not assume the stakeholder’s proposed cause is correct.
Problem Solving with Data Analytics | Google Data Analytics Certificate
Watch “Problem Solving with Data Analytics” from Grow with Google for a compact guide to framing useful, neutral questions.
Watch question quality, especially the examples beginning at 00:17:44 that make questions specific and measurable. Then watch fair wording for the warning about questions that assume an answer. As you watch, compare “How badly did the banner damage sales?” with “How did purchasing change after the banner launched?”
You can use five checks when drafting an analytical question:
- Decision-relevant: Would its answer help the stakeholder choose an action?
- Measurable: What would you count or compare, and who or what is included?
- Scoped: Which store, audience, device, or other boundary matters?
- Time-bound: Which dates are being compared?
- Neutral and answerable: Could the result contradict the stakeholder’s suspicion, and is the necessary data plausibly available?
“Why did the banner reduce sales?” fails the neutrality check. “Did sales change?” is more neutral, but still leaves sales and the comparison period undefined. A well-framed question does not guarantee a reliable answer; it gives you a precise target for checking whether the evidence exists.
Work through a storefront request
Suppose a manager confirms these details: the banner appeared only on mobile product pages in the US store, launched at the start of March 8, 2026, and a decision is needed before the next campaign. They mainly worry that visitors who reach a product page are now less likely to buy.
You could reflect the request back like this:
“I’ll compare purchasing among US mobile sessions that viewed a product page in the full week before launch, March 1–7, and the full week after, March 8–14. I’ll report the share of those sessions that placed an order in the same session, alongside order and revenue totals. Is that the evidence you need for the keep-or-remove decision?”
That conversation produces a primary analytical question:
Among US mobile sessions that viewed a product page, how did the proportion that placed an order in the same session differ between March 1–7 and March 8–14, 2026?
This question makes the work concrete. The population is product-page-viewing mobile sessions in the US store. The measurement is the share of those sessions with an order, not an undefined “sales” figure. The two full weeks provide a specified comparison. The wording allows the proportion to rise, fall, or stay similar.
To calculate that proportion, you would need to count each eligible session once and identify which of those sessions also contained an order. That is a proposed measurement, subject to checking the records—not a promise that product-page views and orders can already be linked correctly. If they cannot be linked by session, tell the manager before presenting the result as a purchasing rate.
Two supporting questions keep the primary result in perspective:
- What happened to mobile order and revenue totals? A change in the share buying does not, by itself, describe the change in sales volume or value.
- Did traffic or measurement change at the same time? A new campaign audience, a tracking change, or incomplete purchase records could affect the comparison.
Even if the post-launch proportion is lower, a before-and-after comparison alone does not establish that the banner caused the decline. You can give the manager a useful comparison and explain what remains uncertain. If the requested evidence is unavailable, a narrower answer—such as a comparison of recorded order totals—must be labelled as such.
Before analysis begins, confirm the question, dates, intended output, and decision deadline in a short written brief. That small step prevents a technically correct analysis of the wrong audience or the wrong meaning of “sales.”
Guided practice: write a request brief
Set aside about 10–12 minutes for a draft you can keep. An Unbounce landing-page owner says: “The new hero section is underperforming. Should we replace it before our next campaign?” The new section launched on May 4, 2026. Daily landing-page visits and successful form submissions are available for April 27–May 10, with device and campaign labels. The owner needs an answer on May 12.
Write a brief using these four lines. Treat anything the scenario does not tell you as something to confirm, not something to invent.
| Line | What to write |
|---|---|
| Decision | The action, decision owner, and deadline |
| Clarification | The most important meaning of “underperforming” to confirm |
| Analytical question | A neutral measurement, audience, and comparison period |
| Evidence and limit | Records needed, one quality check, and what the comparison cannot prove |
Here is one workable version to compare with your draft:
Decision: The landing-page owner will decide by May 12 whether to keep or replace the hero section before the campaign.
Clarification: Does “underperforming” mean fewer successful lead submissions relative to visits, fewer leads overall, or something else?
Analytical question: For visits to this landing page, how did the number of successful form submissions per visit differ between April 27–May 3 and May 4–10, 2026? Check the result by device and campaign if those labels are recorded consistently.
Evidence and limit: Verify that visits and successful submissions use consistent definitions across both weeks, and check whether campaign traffic changed. A difference between the weeks would not, on its own, prove the hero section caused it.
Your wording may differ. What matters is that someone else could identify what to measure and compare, and the owner could say whether the answer would help with the decision. If they instead care primarily about total qualified leads, revise the question rather than defending the first metric you chose.
Key takeaways
Translate a stakeholder request by uncovering the decision, replacing vague terms with an agreed measurement, setting the audience and comparison period, and checking that the question is neutral and answerable. Confirm the resulting brief with the stakeholder before collecting or calculating data.
Next, we’ll make the measurement itself more rigorous by defining a KPI—including its formula, scope, time period, and decision use.