Recommended resources
The freely available resources this lesson will direct you to.
Hello. Last lesson separated an industry’s profit pools from its strategic bottlenecks. To move from an illustrative industry map to a defensible view of a real company, you need to establish what the company sells, how each activity earns revenue, what it costs to operate, and what the disclosures do not reveal.
This lesson builds that reconstruction from two contrasting businesses: Alphabet, which reports several operating segments, and ServiceNow, whose disclosures provide a useful revenue-and-cost breakdown but not operating profit for each offering. Allow about 45 minutes, including the selected reading and video. The aim is not to memorize products; it is to turn public disclosures into a concise, evidence-qualified business model.
Start with the right units of analysis
A company can be divided in several valid but incompatible ways. Reporting segments are the units for which it discloses segment results. Revenue lines describe what it sells. Geographies describe where customers are located. None should be mistaken for another.
The supplied illustration is a useful first glance at Alphabet’s 2024 full-year revenue. Its large Search slice immediately suggests where to investigate, but the slices are revenue categories, not a chart of profit by operating segment.
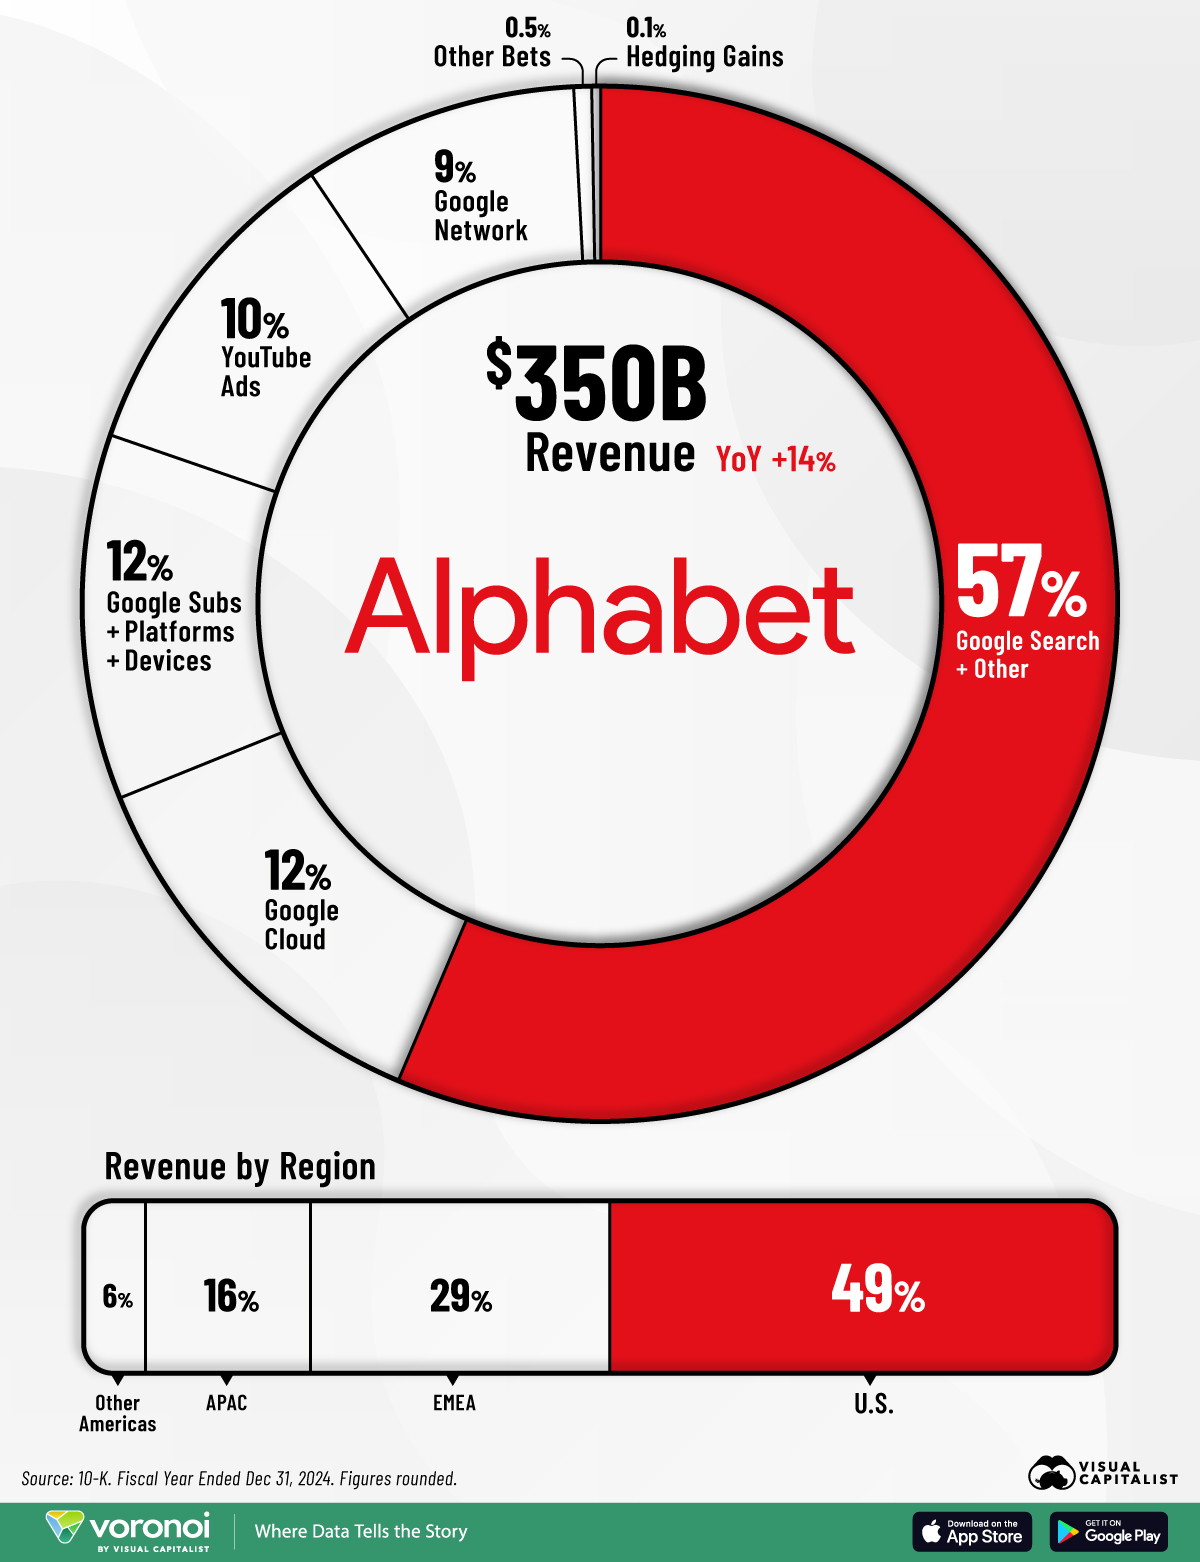
The short passages from Investor Center’s How to Analyze an Annual Report (10-K) Like a Hedge Fund Analyst establish a useful reading order: learn what generates revenue, then look for management’s explanation of changes and margins. The examples concern another company; use the method, not its figures, for the case below.
How to Analyze an Annual Report (10-K) Like a Hedge Fund Analyst
Watch How to Analyze an Annual Report (10-K) Like a Hedge Fund Analyst from Investor Center for its approach to connecting a business description with financial disclosures.
Watch revenue categories to see why the business description comes before the spreadsheet. Then watch management commentary for the move from reported growth to explanations and gross margins. Treat any claim that a high margin alone proves pricing power as a hypothesis to test, not a conclusion.
For a reconstruction, build an evidence chain rather than collecting every disclosed number:
- Perimeter: Which period, accounting basis, and reporting segments are you analyzing?
- Revenue mechanics: Who pays, for what, and on what billing or usage basis?
- Economic results: Which revenues and operating profits are disclosed at the same level of detail?
- Operating indicators: What do volume, contracts, or customer metrics add—and what can they not prove?
- Reconciliation: Do the pieces add to the consolidated figures? Which costs remain shared or unallocated?
An earnings release or presentation can point you toward management’s preferred growth narrative. The filing is where you check its definitions, accounting treatment, and reconciliation. We will use the management discussion within the supplied filings for that second step.
Reconstruct Alphabet: revenue lines inside reporting segments
Use Alphabet’s quarter ended June 30, 2025 throughout this case. That avoids silently combining the 2024 annual illustration with a later quarterly income statement. The 10-Q first disaggregates revenue by type, then defines the reporting segments and their operating results.
goog-10-q-q2-2025.pdf - Alphabet Inc.
Read Alphabet’s Q2 2025 Form 10-Q to distinguish detailed revenue lines from the broader segments for which operating income is reported.
In Note 2, “Revenues,” under “Disaggregated Revenues” (p. 12), read the revenue table and finish its Other Bets, hedging, and total-revenue rows. Use the three months ended June 30, 2025 column, not the six-month column. Then go to Note 15, “Information about Segments and Geographic Areas” (pp. 34–35). Read segment definitions, including the explanation of allocated and Alphabet-level costs. In the table beginning segment results, compare revenue with operating income in that same quarterly column.
Alphabet reports Google Services, Google Cloud, and Other Bets as its segments. Within Services, it separately discloses Search & other, YouTube ads, Network, and subscriptions, platforms, and devices revenue. That extra detail is valuable, but it does not create a disclosed Search operating margin or YouTube operating margin.
Here is a compact reconstruction from the quarterly segment table. Amounts are $ millions; margins are calculated from the reported numbers.
| Q2 2025 reporting unit | Revenue | Operating income or loss | Operating margin |
|---|---|---|---|
| Google Services | 82,543 | 33,063 | 40.1% |
| Google Cloud | 13,624 | 2,826 | 20.7% |
| Other Bets | 373 | (1,246) | Loss exceeds revenue |
| Revenue hedging adjustment | (112) | — | — |
| Alphabet-level activities | — | (3,372) | — |
| Alphabet consolidated | 96,428 | 31,271 | 32.4% |
Two separate bridges make the table trustworthy. The revenue bridge is . The operating-income bridge is . Do not force the revenue hedging adjustment into a product line or mistake Alphabet-level costs for a fourth customer-facing business.
Now look inside the largest segment. Q2 Google Search & other revenue was $54,190 million, or about 56% of Alphabet revenue; total Google advertising, which also includes YouTube ads and Network, was $71,340 million, about 74%. Those facts establish revenue exposure, not the share of company profit produced by Search. Allocating Services’ $33,063 million of operating income to its revenue lines in proportion to sales would invent cost information the filing does not supply.
Revenue mechanics and costs explain why that distinction matters. Read the targeted discussion rather than every product description.
goog-10-q-q2-2025.pdf - Alphabet Inc.
Return to Alphabet’s Q2 2025 Form 10-Q to explain what drives the reported numbers and where a simple margin allocation would fail.
In “Revenues and Monetization Metrics” (pp. 37–38), read advertising mechanics; focus on the distinction between Search paid clicks and Network impressions. In the “Google Cloud” subsection (p. 38), read cloud charging. In “Costs and Expenses,” under “Cost of Revenues” (pp. 38–39), read distribution costs. Finally, in “Segment Profitability” (pp. 45–46), start at the paragraph beginning “Google Services operating income increased” and stop after the paragraph on Google Cloud: compare management’s stated revenue and cost drivers with the segment table.
The resulting business-model account is more informative than “Alphabet sells ads and cloud”:
- Services earns primarily from advertising, alongside subscriptions, platform fees, and devices. Search advertising depends partly on access to users through distribution partners; traffic acquisition costs (TAC) include payments for that access. Network advertising runs on partner properties, and the filing says Network TAC is substantially higher as a percentage of Network ad revenue than for Search & other. Equal advertising revenue therefore need not imply equal retained economics.
- Cloud earns from consumption-based fees and subscriptions for infrastructure and platform services, plus enterprise applications such as Workspace. Its Q2 revenue rose from $10,347 million in 2024 to $13,624 million in 2025, while operating income rose from $1,172 million to $2,826 million. The filing also identifies higher infrastructure-usage and employee-compensation costs; the figures alone cannot isolate how much improvement came from utilization, pricing, mix, or other factors.
- Other Bets combines smaller activities and reported a loss. It should remain in the reconstruction even though its revenue is small.
There is one more qualification to the segment margins: Alphabet allocates some central infrastructure and facilities costs to segments, but keeps certain shared AI research and corporate costs at Alphabet level. Thus Cloud’s reported 20.7% operating margin is a disclosed segment result, not a fully standalone margin for every cloud workload. Nor is the geographic revenue table another set of businesses whose revenues should be added to the segment table: it divides the same consolidated revenue by customer address.
Contrast ServiceNow: detailed economics without product-segment profit
A filing does not always provide the same analytical cut. ServiceNow describes several workflow areas, but its supplied Q2 2025 disclosure lets us quantify subscription versus professional services and other revenue and gross profit—not operating profit by workflow area. Do not relabel those revenue streams as independently reported operating segments.
Read ServiceNow’s Q2 2025 Form 10-Q to build a second reconstruction at the level the company actually discloses.
In Part I, Item 1, “Condensed Consolidated Statements of Comprehensive Income” (p. 2), use the three months ended June 30, 2025 column. Read from the Subscription revenue row through operating income, noting the separate costs of subscription and professional services. Then go to “Components of Results of Operations” (pp. 24–27): under “Revenues,” read recognition mechanics for subscription and services. Under “Cost of Revenues” (p. 25), read the two cost descriptions, from the paragraph beginning “Cost of subscription revenues consists primarily” through the paragraph ending “as the professional services are delivered.” Finally, in “Cost of Revenues and Gross Profit Percentage” (p. 27), compare the two gross-margin rows and the explanation of partner ecosystem spending.
The Q2 2025 statement yields a useful, but deliberately limited, model:
| Disclosed revenue stream | Revenue ($m) | Cost of revenue ($m) | Gross profit ($m) | Gross margin |
|---|---|---|---|---|
| Subscription | 3,113 | 625 | 2,488 | 79.9% |
| Professional services and other | 102 | 99 | 3 | 2.9% |
| Total | 3,215 | 724 | 2,491 | 77.5% |
After $2,133 million of consolidated operating expenses, reported operating income is $358 million. That is an approximately 11.1% consolidated operating margin. The filing does not allocate those sales, research, and administrative expenses between the two rows above, so it does not establish either stream’s operating margin.
The contrast in gross profit sharpens the business-model interpretation. Subscription access and associated support account for most reported revenue and gross profit; professional services and other revenue is small and nearly matched by its delivery costs that quarter. It would be tempting to call those services “unprofitable.” We cannot: their own operating expenses are not separately disclosed, and their purpose may include helping customers adopt subscriptions. The defensible claim is narrower—their disclosed Q2 gross profit was $3 million.
Timing also matters. Cloud-based subscription revenue is generally recognized over the subscription term, whereas a substantial portion of certain self-hosted subscription sales can be recognized upon software delivery. The filing identifies $109 million of upfront-recognized self-hosted revenue within Q2 subscription revenue. A quarterly subscription figure is consequently not interchangeable with annual recurring revenue, bookings, or cash collected.
Use operating metrics as checks, not substitute income statements
Financial statements describe recognized revenue and cost. Operating metrics can test whether that picture is consistent with contract activity or customer expansion, provided you retain each metric’s definition.
Finish the ServiceNow filing with the definitions that qualify its contracted-revenue and customer-growth signals.
In “Key Business Metrics” (pp. 22–23), read RPO definitions, then the subsequent list of reasons RPO varies, ending with the discussion of contract duration. On p. 22, find the paragraph beginning “Number of customers with ACV greater than” and read through its explanation of customer-count comparability. On p. 23, read renewal definition. Pay particular attention to what the renewal rate excludes.
As of June 30, 2025, ServiceNow reported $23.9 billion of remaining performance obligations (RPO); 46%, or roughly $11.0 billion, was current RPO expected to be recognized in the next 12 months. RPO is contracted revenue not yet recognized, subject to its stated scope and timing rules. It is not revenue already earned, an ARR figure, or a forecast that every dollar of next year’s revenue must come from those contracts.
The company also reported 528 customers with annual contract value above $5 million, versus 442 a year earlier, and a 98% renewal rate under its disclosed methodology. Together, these support a picture of substantial large-account contracts and limited loss from the set of contracts assessed for renewal. They do not tell you how much growth came from new customers rather than expansion, or give you net revenue retention. In particular, the stated renewal rate does not capture increases or decreases in purchases from customers that remain customers. Definitions also differ across customer metrics, so avoid combining their counts as if they tracked identical populations.
This is the discipline behind a segment-level reconstruction: a metric is evidence for the question it measures, not for every adjacent question. Alphabet’s paid clicks, for example, are relevant to interpreting Search monetization, but the passages read here do not provide the click counts needed to calculate a volume-versus-price growth bridge. ServiceNow’s RPO informs contracted visibility, but cannot be inserted into the income statement as current revenue.
Turn the evidence into a usable business-model brief
A strong one-page conclusion separates reported facts, interpretation, and unresolved questions. For the two cases, it might read as follows:
Alphabet, Q2 2025: Google Services generated $82.5 billion of revenue and $33.1 billion of segment operating income. Advertising was its principal revenue source; Search distribution payments and Network partner payments create different cost mechanics within advertising. Cloud generated $13.6 billion of revenue and $2.8 billion of segment operating income. Search- or YouTube-level profit cannot be inferred from the disclosed segment result; some shared costs remain at Alphabet level.
ServiceNow, Q2 2025: $3.1 billion of its $3.2 billion revenue was subscription revenue. Subscription gross margin was about 80%, while professional services and other produced $3 million of gross profit. Consolidated operating income was $358 million, but operating profit by revenue stream or workflow area was not disclosed. RPO and large-customer counts add evidence about contracts, not a breakdown of recognized revenue growth.
Those statements are useful because they expose the next questions rather than concealing them. For Alphabet: how do changes in distribution terms, ad formats, and infrastructure costs affect the businesses inside Services and Cloud? For ServiceNow: what portion of growth depends on expanding existing accounts, and how does spending on implementation partners affect future subscription adoption? Each is a testable question, not a fact supplied by these tables.
Keep two final controls on any such brief. First, label GAAP versus adjusted figures: an adjusted operating-income number should not silently replace the reported $358 million for ServiceNow or be compared with Alphabet’s reported segment income. Second, record the date and level of every figure—full-year illustration, quarterly revenue line, reporting segment, or consolidated company. Most persuasive-looking but unsound company profiles fail at one of those joins.
Key takeaways
Reconstruct a business model by defining the reporting perimeter, linking each revenue line to its payer and charging mechanism, calculating profitability only where costs are actually disclosed, and reconciling the result to company totals. Use management’s explanations and operating metrics to investigate why results changed, while preserving their accounting definitions and limits. “Not disclosed” is often an essential finding, not a gap to fill with an invented margin.
Next, you will use these evidence-backed models to define competitor sets around customer needs and control points, rather than assuming that every company sharing a broad software or platform label competes on the same terms.