Recommended resources
The freely available resources this lesson will direct you to.
Hello! Welcome to your next lesson in our module on advanced performance and risk-adjusted returns.
In our last lesson, we explored the Sortino ratio, a metric that sharpens our view of risk by focusing only on downside volatility. We saw how it can provide a more nuanced picture than the Sharpe ratio, especially for investments with high upside potential. This was about measuring the variability of "bad" returns.
Today, we shift our focus from the variability of losses to their maximum potential magnitude. We will tackle the learning outcome: Calculate maximum drawdown from a time series of investment values. Maximum drawdown (MDD) is a critical metric that answers a simple, visceral question: "What is the biggest loss from a peak my investment has ever experienced?" For any investor, understanding this historical worst-case scenario is crucial for assessing risk tolerance and the stomach needed to hold an asset through market cycles.
1. Defining Maximum Drawdown
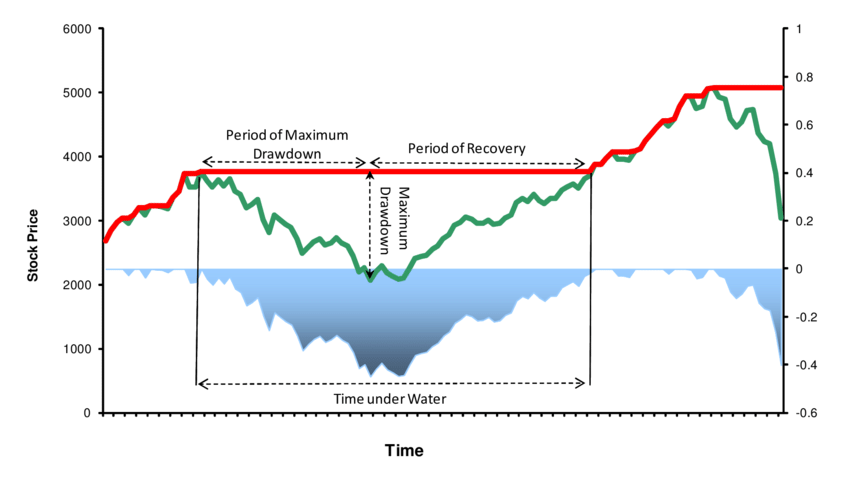
Maximum Drawdown (MDD) is the largest drop from a previous peak to a subsequent trough in the value of an investment, expressed as a percentage. It measures the most painful loss an investor would have endured had they bought at the absolute top and sold at the absolute bottom during a specific period.
This metric is not about volatility or average returns; it's a stark measure of downside risk. Two investments might have the same average return and volatility, but one could have a much larger MDD, making it psychologically harder to hold.
The following image provides an excellent visualization of the concept.
2. The Logic of the Calculation
From your perspective as a software engineer, the calculation of MDD can be broken down into a clear algorithm:
- Track the High-Water Mark: Iterate through your time series of investment values. At each point in time, you need to know the highest value the investment has ever reached up to that point. This is often called the "running maximum" or "cumulative maximum".
- Calculate the Drawdown at Each Point: For every data point in your time series, calculate the percentage difference between the current value and the running maximum at that same point. If the current value is a new high, the drawdown is 0. Otherwise, it will be a negative percentage. This gives you a new time series representing the drawdown at each moment.
- Find the Maximum Drawdown: The MDD is simply the lowest value (i.e., the most negative number) in the drawdown time series you created in step 2.
To see this logic applied with code, the following article provides a clear, step-by-step walkthrough. While it uses stock market returns, the underlying principles of calculating a cumulative series and comparing it to a running maximum are universal.
How to compute drawdown on an investment
The article 'How to compute drawdown on an investment' from PyQuant News provides a great foundation. It explains the concept and then builds Python functions to calculate the drawdown series and the maximum drawdown.
Read the introduction to understand the definition of drawdown. Then, review 'Step 2: Create the drawdown function'. Pay close attention to the logic: it calculates cumulative returns, tracks a running maximum, and then computes the percentage difference. We will use a slightly different, more direct approach for our code, but understanding this logic is key.
3. Python Implementation for Real Estate Values
While the resource above calculates MDD from a series of returns, a more direct method when you have a time series of asset values (like annual property valuations) is to work with the values directly. The pandas library makes this exceptionally clean and efficient.
Let's model the value of a property in Spain over 10 years, which experiences a market correction mid-way through the holding period.
import pandas as pd
import numpy as np

def calculate_max_drawdown(value_series: pd.Series) -> float:
    """
    Calculates the Maximum Drawdown (MDD) from a time series of investment values.

    Args:
        value_series (pd.Series): A pandas Series of investment values,
                                  indexed by time.

    Returns:
        float: The maximum drawdown as a negative float (e.g., -0.20 for a 20% loss).
    """
    # 1. Calculate the running maximum (High-Water Mark) using cummax()
    running_max = value_series.cummax()

    # 2. Calculate the drawdown series. This is the percentage drop from the
    #    running maximum at each point in time.
    drawdown = (value_series - running_max) / running_max

    # 3. The maximum drawdown is simply the minimum value in the drawdown series.
    max_drawdown = drawdown.min()

    return max_drawdown

# --- Example Usage ---

# Hypothetical annual valuation of a property in Madrid
# The property appreciates, then suffers a market correction, then recovers.
property_values_dict = {
    '2015': 300000, # Purchase
    '2016': 315000,
    '2017': 335000,
    '2018': 350000, # Peak Value
    '2019': 320000,
    '2020': 295000,
    '2021': 280000, # Trough Value
    '2022': 305000,
    '2023': 340000,
    '2024': 360000  # New Peak
}
property_values = pd.Series(property_values_dict)
property_values.index = pd.to_datetime(property_values.index)

# Let's see the components
running_max = property_values.cummax()
drawdown_series = (property_values - running_max) / running_max

# Calculate the final MDD
mdd = calculate_max_drawdown(property_values)

# --- Display Results ---
results_df = pd.DataFrame({
    'Value': property_values,
    'High-Water Mark': running_max,
    'Drawdown': drawdown_series
})

print("--- Maximum Drawdown Calculation ---")
print(results_df.to_string(formatters={'Value': '€{:,.0f}'.format, 'High-Water Mark': '€{:,.0f}'.format, 'Drawdown': '{:.2%}'.format}))
print(f"\nPeak Value: €{property_values.loc['2018-01-01']:,}")
print(f"Trough Value: €{property_values.loc['2021-01-01']:,}")
print(f"Maximum Drawdown: {mdd:.2%}")
Dissecting the Output:
The code above will produce a table showing the property value, the high-water mark, and the drawdown for each year.
- You'll see the High-Water Mark climbs to €350,000 in 2018 and then stays there until the property value surpasses it in 2024.
- The Drawdown column is 0% until 2019. It then becomes negative, reaching its most negative point in 2021.
- The Maximum Drawdown is calculated from the 2018 peak (€350,000) to the 2021 trough (€280,000).
The use of value_series.cummax() is a powerful pandas feature that perfectly implements the "High-Water Mark" logic in a single, efficient step. The rest of the calculation flows directly from there.
Test your understanding!
You are analyzing a different property investment with the following projected year-end values:
[€200_000, €220_000, €250_000, €230_000, €210_000, €190_000, €215_000, €240_000, €260_000]
- What is the peak value and what is the subsequent trough value that determine the maximum drawdown?
- Calculate the Maximum Drawdown (MDD) as a percentage.
- How would you use the Python function we just wrote to verify your result?
Show answer
-
Peak and Trough: The value series peaks at €250,000 (in year 3). After this peak, the lowest point it reaches is €190,000 (in year 6).
-
MDD Calculation:
The Maximum Drawdown is -24.0%. -
Python Verification: You would create a pandas Series from the list of values and pass it to the
calculate_max_drawdownfunction.values = [200000, 220000, 250000, 230000, 210000, 190000, 215000, 240000, 260000] value_series = pd.Series(values) mdd = calculate_max_drawdown(value_series) print(f"Verified MDD: {mdd:.2%}") # Expected output: Verified MDD: -24.00%
Conclusion
You have now mastered another essential risk metric. While the Sharpe and Sortino ratios measure risk through the lens of volatility, Maximum Drawdown provides a direct, unambiguous measure of the largest loss an investment has historically suffered. It's a powerful tool for stress-testing your own risk tolerance before you invest.
Key Takeaways:
- Maximum Drawdown (MDD) is the largest percentage loss from a peak to a subsequent trough in an investment's value.
- It quantifies the "worst-case" loss over a historical period.
- The calculation involves tracking a High-Water Mark (
.cummax()), calculating a drawdown series at each point in time, and finding the minimum of that series. - MDD is valuable for understanding the potential downside and the psychological resilience required to hold an asset.
Preview of the Next Lesson:
In our next lesson, we will have a practical coding session. We will write a Python script that brings together several of the advanced metrics we've learned in this module—including MIRR, the Sharpe Ratio, and Maximum Drawdown—into a consolidated function. This will allow you to run a comprehensive risk and return analysis on a potential investment with a single command, moving us closer to building a complete portfolio analysis toolkit.