Recommended resources
The freely available resources this lesson will direct you to.

Hello! Welcome to the first lesson of Module 4.
In the previous module, we sharpened our focus on the micro-level, building a Python script to analyze and compare the financial metrics of individual properties. You learned how to use Cap Rate, Cash-on-Cash Return, and GRM to assess a deal's numbers.
Now, we zoom out. A great property in a declining market is a losing proposition, while an average property in a booming market can be a fantastic investment. The success of any real estate investment is fundamentally tied to the health of its surrounding market. This module is all about learning to read that market.
Today's lesson directly addresses the learning outcome: Analyze key market demographic and economic indicators (population growth, job growth, median income). We will explore these three pillars of housing demand, learn how to interpret them in the Spanish context, and, leveraging your background, see how to start gathering this data programmatically.
1. The Three Pillars of Housing Demand
At its core, the demand for housing is driven by a simple, logical chain:
- Population Growth: More people need more places to live. This is the most fundamental driver.
- Job Growth: A strong and growing economy creates jobs, which attracts people to an area and gives them the financial stability to rent or buy homes.
- Income Growth: The quality of jobs, reflected in rising income levels, determines a population's purchasing power. Higher incomes support higher rents and property values, directly fueling your investment returns.
Think of these as the "macro story" of an investment. Your property-level analysis from Module 3 is the "micro story." A successful investment happens when both stories are compelling.
The Bank of Spain, in its 2023 annual report, provides an excellent overview of how these factors influence the Spanish housing market. We will refer to this report to ground our analysis in authoritative data.
Informe Anual 2023. Capítulo 4
To understand the interplay of these forces in Spain, we'll start by reading a section from the Banco de España's 2023 Annual Report. This chapter provides a high-level analysis of the key drivers of housing demand.
Please read Section 3.1, 'El impulso de la demanda de vivienda' (The impulse of housing demand). As you read, focus on identifying how the report links demographic changes, employment, and income to the dynamics of the housing market.
2. Analyzing the Indicators in Spain
Let's break down each indicator using insights from the report you just read.
Population Growth
As the Bank of Spain report highlights, population growth is a cornerstone of housing demand in Spain.
- Key Driver: The report emphasizes that recent growth is primarily fueled by international migration ("saldos migratorios del exterior"), which is creating a significant number of new households annually. This translates directly into demand for rental units and, eventually, purchases.
- Geographic Concentration: This growth is not uniform across the country. It is heavily concentrated in major urban and coastal areas like Madrid, Cataluña, Andalucía, and the Comunitat Valenciana. For an investor, this is a crucial insight: you must focus your analysis on specific provinces and municipalities, not just national averages.
- Impact on Prices: The report explicitly shows a strong positive correlation between population growth and rising property prices and rents in Spanish municipalities (see Graph 4.8 in the report). Where the population grows, prices tend to follow.
Job Growth
People follow jobs. A robust and diverse job market is the engine that sustains population growth and ensures tenants can pay their rent.
- Economic Context: The Bank of Spain report points to a "favorable macroeconomic context" with "sustained growth in employment" since 2014 as a key factor supporting the housing market.
- Visualizing the Trend: The chart below shows the evolution of public and private employment in Spain over two decades.

As an investor, you'd look for areas with not just job growth, but a diverse range of industries. A town reliant on a single factory is far riskier than a city with a mix of tech, healthcare, tourism, and logistics jobs.
Income Growth
Job growth provides the tenants, but income growth provides the returns. It determines a market's capacity for rent increases and property appreciation.
- Affordability: The Bank of Spain report discusses affordability using the price-to-income ratio, which measures how many years of a median household's gross income are needed to buy an average-priced home. The report notes this indicator has risen significantly, suggesting that prices have grown faster than incomes, making access to ownership more difficult and increasing demand for rentals.
- Geographic Disparity: Income levels vary dramatically across Spain, which directly impacts property values and rental potential. The map below provides a clear visual of this.
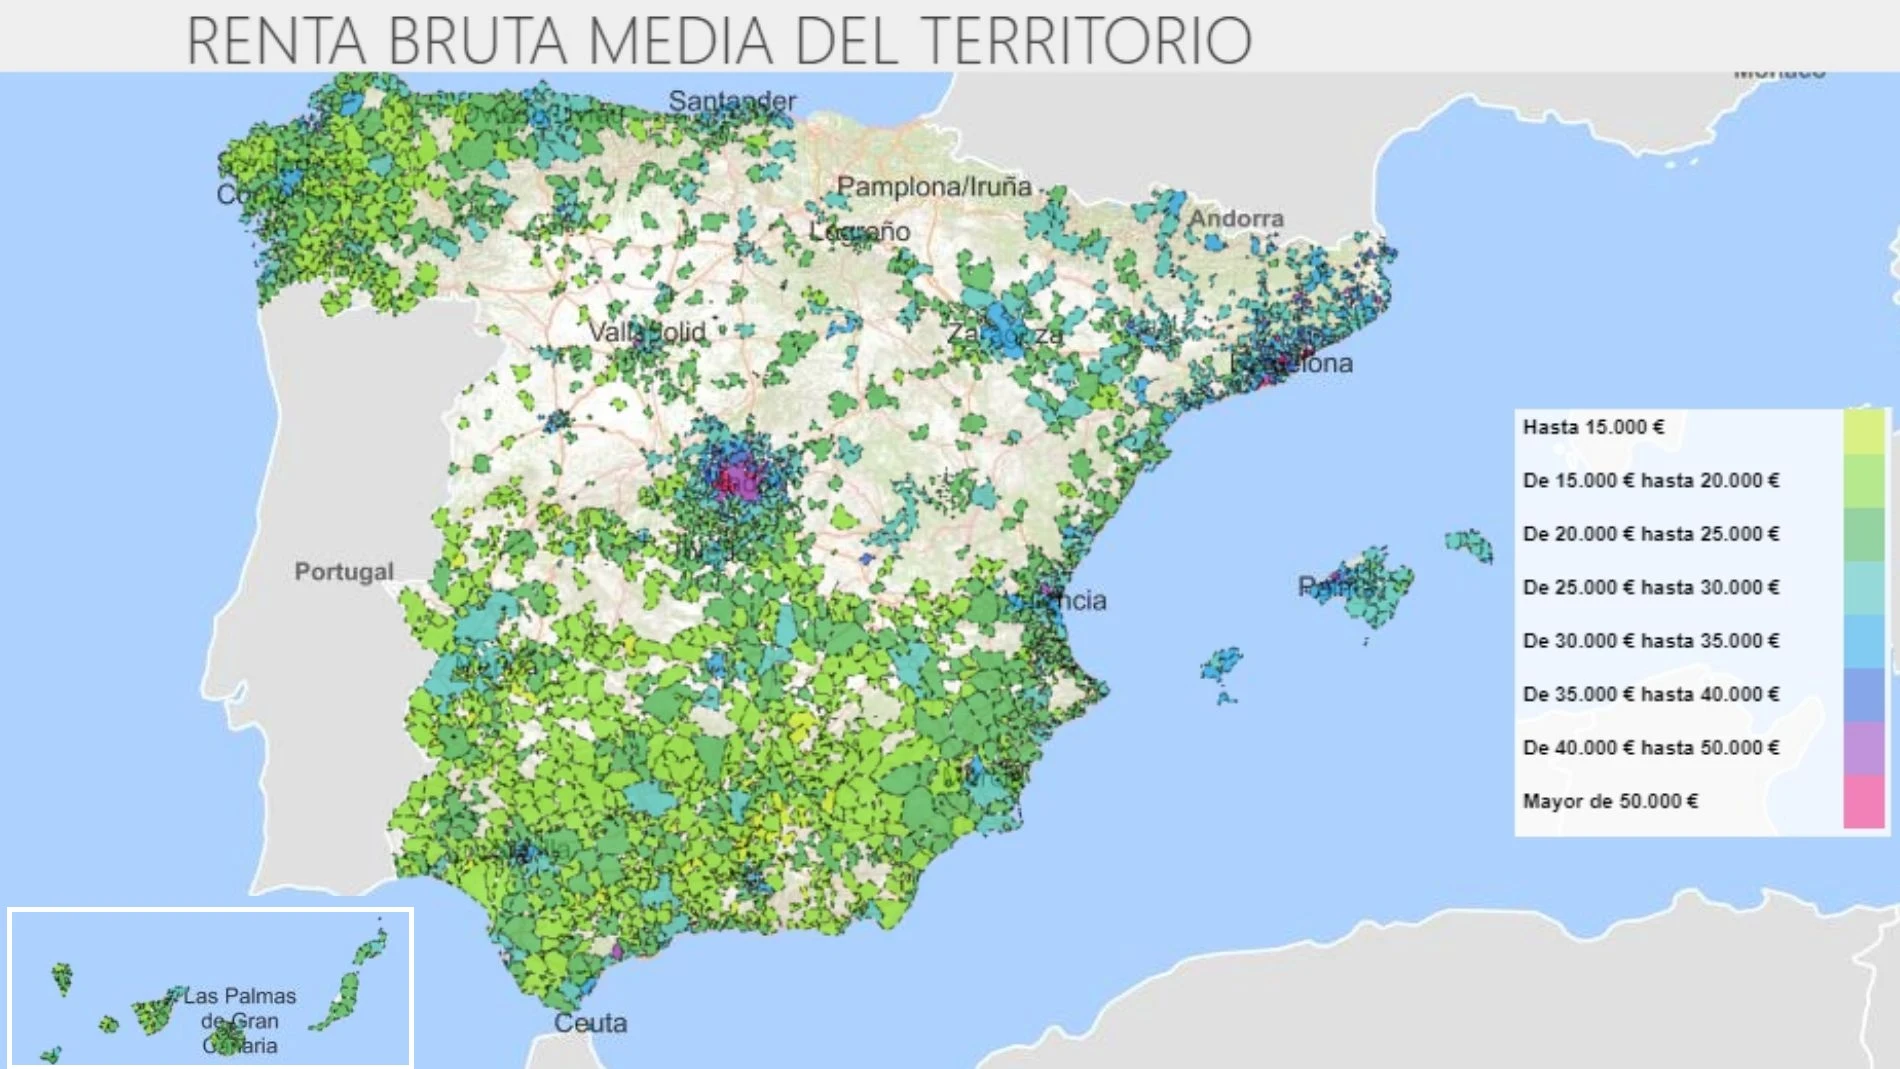
When analyzing a market, you want to see a trend of rising median household incomes. This signals a healthy economy and gives you confidence that you can increase rents over your holding period.
Test your understanding!
Imagine you are comparing two cities for a potential investment.
- City A has high population growth but stagnant job growth and low median income.
- City B has modest population growth but strong, diverse job growth and rising median income.
Which city presents a more sustainable long-term investment, and why?
Show answer
City B is the more sustainable long-term investment. While City A's population growth might create initial demand, the lack of job and income growth suggests this demand is not economically supported. It could lead to a market with high vacancy rates, downward pressure on rents, and higher tenant default risk.
City B, on the other hand, has the economic fundamentals in place. The strong job market will likely continue to attract and retain a population with growing financial capacity, supporting stable tenancies, rent growth, and property appreciation over time.
3. Practical Application: Sourcing Data with Python
As a software engineer, you don't have to rely on manually searching for PDF reports. Spain's National Statistics Institute (Instituto Nacional de Estadística - INE) provides an API to access this data directly, allowing you to automate your market research.
Let's walk through the process of fetching population data for Spain, as outlined in the following resource.
Extracción de datos del INE mediante API
This blog post provides a practical, step-by-step guide on how to use Python to retrieve data from the INE's API. It's a perfect example of how you can apply your programming skills to real estate analysis.
Read through the entire post. Pay close attention to the two main steps: 1) How to find the specific code for a data series on the INE website. 2) The structure of the Python script used to make the API call and process the JSON response into a usable format with pandas.
Building the Python Script
Based on the article, let's create a simple script to fetch the total population of Spain. This serves as a template that you can adapt for countless other datasets like employment, household formation, and more.
First, ensure you have the necessary libraries. If you don't, you can install them via pip:pip install requests pandas
Now, here is the script. It follows the logic from the article you just read.
import requests
import pandas as pd
from datetime import datetime

def fetch_ine_data(series_code: str, num_results: int = 999):
    """
    Fetches a specific data series from the Spanish INE API.

    :param series_code: The code for the data series (e.g., 'CP335' for population).
    :param num_results: The number of recent data points to fetch.
    :return: A pandas DataFrame with the requested data.
    """
    # 1. Construct the API URL
    url_template = 'https://servicios.ine.es/wstempus/js/ES/DATOS_SERIE/{code}?nult={num}'
    url = url_template.format(code=series_code, num=num_results)

    print(f"Fetching data from: {url}")

    # 2. Make the API request
    try:
        response = requests.get(url)
        response.raise_for_status()  # Raises an HTTPError for bad responses (4xx or 5xx)
        json_data = response.json()
    except requests.exceptions.RequestException as e:
        print(f"API request failed: {e}")
        return None
    except ValueError:
        print("Failed to decode JSON from response.")
        return None

    # 3. Process the JSON data into a DataFrame
    series_name = json_data.get('Nombre', 'Unknown Series')
    data_points = json_data.get('Data', [])

    if not data_points:
        print("No data found in the response.")
        return pd.DataFrame()

    records = []
    for point in data_points:
        # The timestamp is in milliseconds, so we divide by 1000
        date = datetime.fromtimestamp(point['Fecha'] / 1000)
        value = point['Valor']
        records.append({'Date': date, 'Value': value})

    df = pd.DataFrame(records)
    df.rename(columns={'Value': series_name}, inplace=True)
    df.set_index('Date', inplace=True)

    return df

# --- Example Usage ---
# 'CP335' is the INE code for the total population of Spain.
# We found this by browsing the INE website as described in the blog post.
population_df = fetch_ine_data('CP335')

if population_df is not None and not population_df.empty:
    print("\n--- Latest Spanish Population Data ---")
    # Display the 5 most recent data points, sorted by date
    print(population_df.sort_index(ascending=False).head())

    # You could also easily plot this data
    # population_df.plot(title="Spanish Population Over Time")
    # plt.show()
This script is a foundational tool. By finding the correct series codes on the INE website, you can use this exact function to pull data on regional employment, income statistics, and much more, creating your own market analysis dashboard.
Conclusion
In this lesson, you've taken the crucial step from analyzing a property in isolation to understanding the market forces that will determine its long-term success.
Key Takeaways:
- A healthy real estate market is underpinned by three pillars: population growth, job growth, and income growth.
- In Spain, these trends are often driven by migration and are highly concentrated in specific geographic areas, making localized analysis essential.
- Authoritative sources like the Banco de España provide qualitative context, while the Instituto Nacional de Estadística (INE) provides the raw quantitative data.
- With your Python skills, you can automate data collection from the INE API, creating a powerful advantage in your market research.
Preview of the Next Lesson:
We've now established how to measure the fundamental drivers of demand. But demand is only half of the picture. In our next lesson, we will focus on the other side of the economic coin: supply. We will learn to calculate and interpret supply/demand indicators like absorption rate, months of supply, and price-to-rent ratio. These metrics will tell you whether a market is oversupplied or undersupplied, helping you to forecast future rent and price movements.