Recommended resources
The freely available resources this lesson will direct you to.
Hello! Welcome to the final lesson in our module on Market Analysis and Property Due Diligence.
Throughout this module, we've dissected a potential investment from multiple angles: analyzing market data, assessing neighborhood quality, inspecting the property's physical condition, and evaluating leases, tenants, and management. You've now gathered a large amount of information, some of it quantitative (like price-to-rent ratios) and much of it qualitative (like school ratings or property condition). The challenge is synthesizing this into a coherent, comparable decision. How do you weigh a great location against the need for a new roof?
Today, we'll address that challenge directly. Our learning outcome is to create a scoring model to quantify qualitative property and market factors. We will build a systematic framework that translates subjective assessments and disparate data points into a single, objective score. This allows you to compare different properties on an apples-to-apples basis, guided by your specific investment strategy.
This concept is a cornerstone of decision theory and is widely used in business and engineering for prioritization—a process you are likely familiar with from product and project management.
1. The Weighted Scoring Model: Turning Gut Feelings into Data
When faced with a complex decision involving many factors, it's easy to get overwhelmed or give too much weight to a single, emotionally charged data point. A weighted scoring model, also known as a decision matrix, provides a structured and semi-objective way to evaluate your options.
The core idea is simple:
- List your decision criteria (the factors that matter).
- Assign a weight to each criterion based on its importance to you.
- Score each of your options (e.g., different properties) against each criterion.
- Calculate a final weighted score for each option.
This forces you to be explicit about your priorities and apply them consistently.
To start, let's watch a quick video that provides a high-level overview of this technique.
Decision Matrix Analysis: How to Make a Good Decision by Weighing Up Different Factors
This video from MindToolsVideos, 'Decision Matrix Analysis', explains the fundamental concept in under two minutes. Pay attention to the four key steps: listing options, defining factors, weighting the factors, and scoring the options.
Watch the full video (it's short!). It clearly illustrates the process of building the matrix and calculating the final scores.
Now that you have the basic idea, we will dive deeper into the methodology, using a framework adapted from the world of product management, where this technique is used to prioritize features.
Weighted Scoring Model: Step-by-Step Implementation ...
The article 'Weighted Scoring Model: Step-by-Step Implementation' from Product School offers a detailed guide that we can adapt perfectly for real estate analysis. It breaks the process down into clear, actionable steps.
Please read the introduction ('What is a Weighted Scoring Model?') to solidify your understanding. Then, familiarize yourself with the six steps outlined in 'Steps to Implement a Weighted Scoring Model...'. Finally, review the 'Pros and Cons' section to understand the model's strengths and limitations.
2. Building Your Real Estate Scoring Model: A Step-by-Step Guide
Let's apply the six-step process from the Product School article to create a practical scoring model for comparing two hypothetical properties in Spain.
- Property A: A 2-bedroom apartment in the Salamanca district of Madrid. High purchase price, excellent condition, prime location, stable tenant profile.
- Property B: A 3-bedroom apartment near the beach in Valencia. Lower purchase price, needs cosmetic updates, in an up-and-coming area with high tourist rental potential.
Step 1: Define the Criteria
First, we must identify the factors that will drive our decision. We can group the qualitative and quantitative factors we've discussed in previous lessons into logical categories. A useful structure is to think in terms of Market, Property, and Deal Structure.
- Market/Location (Weight: 35%)
Neighborhood Quality: Schools, safety, amenities, walkability.Economic Strength: Job growth, population trends, income levels.Rent Stability & Growth: Local vacancy rates, rent appreciation trends.
- Property Condition & Desirability (Weight: 35%)
Physical Condition: Age of major systems (roof, plumbing, electrical), inspection report findings.Layout & Features: Number of bedrooms/bathrooms, floor plan efficiency, balcony, light.Legal & Tenant Quality: Lease terms, existing tenant solvency (if applicable).
- Deal Structure & Financials (Weight: 30%)
Value-Add Potential: Opportunity to increase value through renovations or management improvements.Price vs. Market Value: Is the property priced below comparable sales?Initial Return Profile: A qualitative check on how metrics like CoC Return and GRM look.
Step 2: Assign Weights
This is where you embed your personal investment strategy into the model. The weights must sum to 100%. Are you a conservative investor who prioritizes stability, or are you looking for growth and willing to take on more risk?
Let's assume a "Balanced Growth" strategy for our example:
| Category | Criterion | Weight | Rationale |
|---|---|---|---|
| Market | Neighborhood Quality | 15% | A great neighborhood provides a long-term safety net. |
| Economic Strength | 10% | Strong fundamentals drive future appreciation and rent growth. | |
| Rent Stability & Growth | 10% | Directly impacts income potential. | |
| Property | Physical Condition | 15% | Poor condition can quickly destroy returns via CapEx. |
| Layout & Features | 10% | Affects tenant demand and rentability. | |
| Legal & Tenant Quality | 10% | Reduces risk of vacancy and legal issues. | |
| Deal | Value-Add Potential | 15% | Key for forcing appreciation and boosting returns. |
| Price vs. Market Value | 10% | "You make your money when you buy." | |
| Initial Return Profile | 5% | A final check on the immediate numbers. | |
| Total | 100% |
Step 3: Score Each Option
Now, you score each property against each criterion using a consistent scale, for example, 1 (Poor) to 5 (Excellent). It is crucial to define what each number means to maintain objectivity.
- Neighborhood Quality (1-5):
- 1: High crime, poor services.
- 3: Average, safe, some services.
- 5: Prime, highly desirable, excellent services.
- Physical Condition (1-5):
- 1: Needs major structural/system repairs immediately.
- 3: Dated but functional; cosmetic updates needed.
- 5: Turnkey, recently renovated.
Step 4 & 5: Calculate Scores and Analyze Results
Multiply the score for each criterion by its weight to get the weighted score. Then, sum these scores for a total.
Let's see how our two properties might compare:
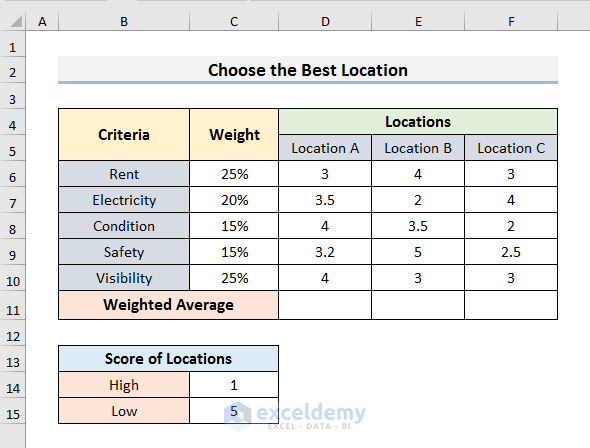
Here is our completed analysis for Property A and Property B:
| Criterion | Weight | Prop A Score | Prop A Weighted | Prop B Score | Prop B Weighted |
|---|---|---|---|---|---|
| Market | |||||
| Neighborhood Quality | 15% | 5 | 0.75 | 3 | 0.45 |
| Economic Strength | 10% | 4 | 0.40 | 4 | 0.40 |
| Rent Stability/Growth | 10% | 4 | 0.40 | 5 | 0.50 |
| Property | |||||
| Physical Condition | 15% | 5 | 0.75 | 2 | 0.30 |
| Layout & Features | 10% | 3 | 0.30 | 4 | 0.40 |
| Legal & Tenant | 10% | 4 | 0.40 | 3 | 0.30 |
| Deal | |||||
| Value-Add Potential | 15% | 1 | 0.15 | 5 | 0.75 |
| Price vs. Market | 10% | 3 | 0.30 | 4 | 0.40 |
| Initial Return Profile | 5% | 3 | 0.15 | 4 | 0.20 |
| TOTAL | 100% | 3.60 | 3.70 |
Analysis:
Even though Property A (Madrid) is in a prime location and perfect condition, its low value-add potential and higher price bring its score down. Property B (Valencia), despite needing work and being in a less-established neighborhood, scores slightly higher due to its high value-add potential, better layout, strong rent growth prospects, and more attractive entry price.
Based on our "Balanced Growth" strategy, Property B appears to be the better investment opportunity. This model helped us look past the prestige of the Madrid location and objectively weigh the trade-offs.
Test your understanding!
Imagine you are a very conservative investor who prioritizes capital preservation and stable income above all else. How might you change the weights in the model above? Which property would likely score higher with your new weights?
Show answer
A conservative investor would increase the weights for factors related to safety and stability and decrease the weights for factors related to risk and growth.
You might adjust the weights like this:
- Increase:
Neighborhood Quality(to 20%),Physical Condition(to 20%),Legal & Tenant Quality(to 15%). - Decrease:
Value-Add Potential(to 5%),Rent Stability & Growth(to 5%).
With these new weights, Property A (the stable, prime Madrid property) would almost certainly score higher than Property B (the value-add Valencia property), as its strengths in condition and location would be amplified, and its weakness in value-add potential would be minimized.
3. Implementing the Scoring Model in Python
As a software engineer, you can easily translate this logic into a reusable tool. The structure of the model lends itself well to dictionaries and simple functions. This approach is inspired by the "Decision Engine" concept in the GitHub repository you can see below.
aniket-work/real-estate-investment-analyzer
This GitHub project, 'AI-Powered Real Estate Investment Analyzer', demonstrates a sophisticated, agent-based system for property analysis. We won't build the whole thing, but we'll borrow the core idea from its 'Decision Engine'.
Scan the 'Architecture' and 'How It Works' sections. Notice how it breaks down the analysis into 'Market', 'Property', and 'Financial' components. Then, look closely at the 'Adjust Scoring Weights' code snippet in the 'Customization' section. This is exactly what we will implement.
Here's a simple Python implementation of our scoring model:
# Define the weights based on our investment strategy
weights = {
    "neighborhood_quality": 0.15,
    "economic_strength": 0.10,
    "rent_growth": 0.10,
    "physical_condition": 0.15,
    "layout_features": 0.10,
    "legal_tenant": 0.10,
    "value_add_potential": 0.15,
    "price_vs_market": 0.10,
    "initial_returns": 0.05,
}

# Define the scores for our two properties
property_a_scores = {
    "neighborhood_quality": 5,
    "economic_strength": 4,
    "rent_growth": 4,
    "physical_condition": 5,
    "layout_features": 3,
    "legal_tenant": 4,
    "value_add_potential": 1,
    "price_vs_market": 3,
    "initial_returns": 3,
}

property_b_scores = {
    "neighborhood_quality": 3,
    "economic_strength": 4,
    "rent_growth": 5,
    "physical_condition": 2,
    "layout_features": 4,
    "legal_tenant": 3,
    "value_add_potential": 5,
    "price_vs_market": 4,
    "initial_returns": 4,
}

def calculate_weighted_score(scores, weights):
    """Calculates the total weighted score for a property."""
    total_score = 0
    for criterion, score in scores.items():
        if criterion in weights:
            total_score += score * weights[criterion]
        else:
            print(f"Warning: No weight found for criterion '{criterion}'")
    return total_score

# Calculate and compare the final scores
score_a = calculate_weighted_score(property_a_scores, weights)
score_b = calculate_weighted_score(property_b_scores, weights)

print(f"Property A (Madrid) Final Score: {score_a:.2f}")
print(f"Property B (Valencia) Final Score: {score_b:.2f}")

if score_a > score_b:
    print("Recommendation: Property A is the better fit for this strategy.")
elif score_b > score_a:
    print("Recommendation: Property B is the better fit for this strategy.")
else:
    print("Recommendation: Both properties score equally.")
This simple script automates the calculation and makes it easy to adjust weights or add new properties to compare. You can expand this into a more robust class or integrate it into a larger analysis program.
Conclusion
You have now learned how to bridge the gap between qualitative due diligence and quantitative decision-making. By creating a weighted scoring model, you can systematically evaluate and compare investment opportunities, ensuring your decisions are aligned with your strategic goals and not just your gut feelings.
Key Takeaways:
- A weighted scoring model is a powerful tool for quantifying qualitative factors and making complex decisions.
- The process involves defining criteria, assigning weights that reflect your strategy, and scoring options consistently.
- This framework forces clarity and objectivity, reducing emotional bias and providing a transparent rationale for your choice.
- The model's logic can be easily implemented in Python, creating a reusable and customizable tool for your investment analysis toolkit.
Preview of the Next Lesson:
This was the final theory lesson of the module. In our next session, we'll get our hands dirty with code. The learning outcome is to write a Python script to fetch and analyze demographic and market data for a specific area using a public API. We will learn how to programmatically gather the raw data needed to populate the "Market" criteria of the very scoring model we just designed, making your analysis process even more efficient and data-driven.