Recommended resources
The freely available resources this lesson will direct you to.
- Subquery in SQL | Correlated Subquery + Complete SQL Subqueries Tutorialwww.youtube.com
- SQL Subquery (Visually Explained) | Complete Guide with Correlated Subquery | #SQL Course 27www.youtube.com
- Writing Subqueries in SQL | Advanced SQL | ThoughtSpotmode.com
- PostgreSQL: Documentation: 18: 7.2. Table Expressionswww.postgresql.org
Hello! Last lesson, you calculated several regional metrics from the same rows by putting conditions inside aggregates. This lesson addresses a different shape of question: what if the number you want depends on a result you must calculate first? For example, “What is the average number of paid orders per day in each region?” requires daily counts before regional averages.
You’ll use non-correlated subqueries to give each calculation its own level. The goal is not simply to nest SQL, but to make the grain and meaning of each metric clear—a useful habit when building reports or explaining a query in an analyst interview.
Give the outer query a result set to work with
A subquery is a SELECT statement inside another SQL statement. A non-correlated subquery does not refer to columns from its surrounding query: you can run the inner SELECT on its own and inspect its result. When it appears in FROM, that result behaves like a table for the outer query.
Watch the opening of SQL Subquery (Visually Explained) from Data with Baraa. Concentrate on the distinction between a useful intermediate result and the final report.
SQL Subquery (Visually Explained) | Complete Guide with Correlated Subquery | #SQL Course 27
Data with Baraa introduces subqueries as a way to give a multi-step calculation readable parts, then distinguishes independent from dependent subqueries.
Watch the core idea for the inner and outer query roles, staged calculations for why the split helps, and independence for the definition of a non-correlated subquery. Treat “inner first, outer second” as a way to reason about the result, not a guarantee about PostgreSQL’s physical execution plan.
The image below shows the shape of a FROM subquery: the inner query selects employees whose sales exceed 500; the outer query totals income and sales by occupation. Its square-bracket column notation belongs to a different SQL dialect, so use it to recognize the structure rather than as PostgreSQL code.
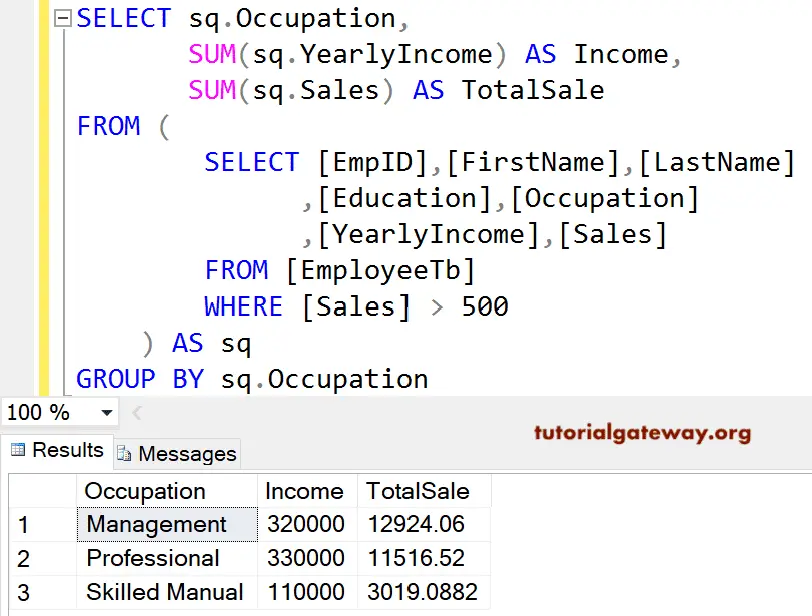
Filtering employees and then grouping them would not, by itself, require a subquery. Its real analytical value becomes clearer when both stages calculate something—daily counts in one stage, for instance, followed by averages of those counts in another.
Read the two short sections of ThoughtSpot’s SQL Subqueries: How to Write Nested Queries with that question in mind.
Writing Subqueries in SQL | Advanced SQL | ThoughtSpot
ThoughtSpot’s tutorial shows how a result produced by one query can become the input to another, including a count-then-average example.
In “Subquery basics,” read the explanation and example, stopping in the formatting note before the “Practice Problem.” Then, in “Using subqueries to aggregate in multiple stages,” read the count then average example, stopping before its practice problem. Focus on what one row represents at each stage; the example’s date-cleaning syntax is not needed here.
Calculate at the daily grain first
We’ll keep the orders and amounts from the previous lesson, adding an order date. This setup is self-contained if you are using a new PostgreSQL session:
CREATE TEMP TABLE orders_stage (
    order_id integer PRIMARY KEY,
    region text,
    ordered_on date,
    status text,
    amount numeric(10, 2)
);

INSERT INTO orders_stage
    (order_id, region, ordered_on, status, amount)
VALUES
    (1, 'North', '2025-01-01', 'paid',      100.00),
    (2, 'North', '2025-01-01', 'paid',       50.00),
    (3, 'North', '2025-01-02', 'cancelled',  40.00),
    (4, 'North', '2025-01-02', 'pending',    70.00),
    (5, 'South', '2025-01-01', 'paid',       80.00),
    (6, 'South', '2025-01-01', 'cancelled',  20.00),
    (7, 'South', '2025-01-02', 'paid',        NULL),
    (8, 'South', '2025-01-03', 'pending',    30.00),
    (9, 'South', '2025-01-03', NULL,         10.00);
Suppose the request is: For each region, report the average and peak number of paid orders per day on which that region had any orders. The unit being averaged is a day, not an individual order. First, produce one row per region and date:
SELECT
    region,
    ordered_on,
    SUM(CASE WHEN status = 'paid' THEN 1 ELSE 0 END)
        AS daily_paid_orders
FROM orders_stage
GROUP BY region, ordered_on
ORDER BY region, ordered_on;
| region | ordered_on | daily_paid_orders |
|---|---|---|
| North | 2025-01-01 | 2 |
| North | 2025-01-02 | 0 |
| South | 2025-01-01 | 1 |
| South | 2025-01-02 | 1 |
| South | 2025-01-03 | 0 |
This is the intermediate result set. Notice that North’s January 2 and South’s January 3 remain present with zero paid orders: those dates had orders, just none marked paid. If we filtered to WHERE status = 'paid' before grouping, both zero-paid days would vanish, changing the average.
Now the daily result has exactly the columns the next calculation needs. We do not need to carry order_id, status, or amount into it.
Average the daily results
Put the daily query inside FROM and give it an alias. The outer query can then group its five rows by region:
SELECT
    day_counts.region,
    COUNT(*) AS days_with_orders,
    SUM(day_counts.daily_paid_orders) AS paid_orders,
    ROUND(AVG(day_counts.daily_paid_orders), 2)
        AS avg_paid_orders_per_day_with_orders,
    MAX(day_counts.daily_paid_orders)
        AS peak_paid_orders_on_one_day
FROM (
    SELECT
        region,
        ordered_on,
        SUM(CASE WHEN status = 'paid' THEN 1 ELSE 0 END)
            AS daily_paid_orders
    FROM orders_stage
    GROUP BY region, ordered_on
) AS day_counts
GROUP BY day_counts.region
ORDER BY day_counts.region;
| region | days_with_orders | paid_orders | avg_paid_orders_per_day_with_orders | peak_paid_orders_on_one_day |
|---|---|---|---|---|
| North | 2 | 2 | 1.00 | 2 |
| South | 3 | 2 | 0.67 | 1 |
At the inner level, SUM(CASE ...) counts paid orders within each region-day. At the outer level, AVG(...) averages those daily counts within each region. North’s average is the mean of 2 and 0; South’s is the mean of 1, 1, and 0. Although both regions have two paid orders overall, their daily patterns differ.
COUNT(*) in the outer query counts intermediate rows, so it means days with orders, not orders. This is why knowing the grain of a subquery matters: the same aggregate function can answer a different business question after the input grain changes.
PostgreSQL calls a subquery in FROM a derived table. Check its syntax and alias convention in the PostgreSQL documentation:
PostgreSQL: Documentation: 18: 7.2. Table Expressions
The PostgreSQL documentation confirms how to write a derived table and why an alias is good practice, particularly when a subquery groups or aggregates rows.
In Section 7.2.1.3, “Subqueries,” read the derived table guidance, stopping before Section 7.2.1.4, “Table Functions.” Relate its FROM (SELECT ...) AS alias_name pattern to AS day_counts above.
The inner query is non-correlated because nothing inside it refers to day_counts or another column belonging to the outer query. You can run it independently to verify the five daily rows before adding the outer calculation.
There is one important boundary to the metric: “days with orders” is not “all calendar days.” A date with no orders in a region produces no intermediate row and does not enter this average. The SQL matches the stated request; a report that includes zero-order calendar days would need a different source of dates.
Use a single intermediate metric as a threshold
A non-correlated subquery can also return one value rather than a table of daily rows. Suppose you want paid orders whose recorded amount exceeds the average recorded paid-order amount across all regions. Calculate that benchmark independently:
SELECT AVG(amount)
FROM orders_stage
WHERE status = 'paid';
AVG ignores the paid order whose amount is NULL, so the benchmark uses 100, 50, and 80: approximately 76.67. Put the same query where the comparison needs its value:
SELECT
    order_id,
    region,
    amount
FROM orders_stage
WHERE status = 'paid'
  AND amount > (
      SELECT AVG(amount)
      FROM orders_stage
      WHERE status = 'paid'
  )
ORDER BY order_id;
This returns order 1 (100.00) and order 5 (80.00). The inner query is a scalar subquery: here it returns one column and one row, suitable for comparison with >. The paid order with a missing amount cannot pass that comparison. A query returning several regional averages instead would not be a single threshold for this operator.
Watch the worked WHERE example in SQL Subquery (Visually Explained) to see the same pattern applied to prices:
SQL Subquery (Visually Explained) | Complete Guide with Correlated Subquery | #SQL Course 27
Data with Baraa demonstrates a non-correlated average used as a comparison value in a WHERE clause.
Watch the average comparison. Identify the query that computes one benchmark and the outer query that selects rows above it; compare those roles with the paid-order query above.
This benchmark is global, not region-specific: neither the inner query nor its average changes according to the outer row’s region. The next lesson will address subqueries that do refer to the current outer row or group.
Key takeaways
A non-correlated subquery stands on its own and supplies an intermediate result to a surrounding query. In FROM, it can change the grain—here, from orders to region-days—so an outer query can calculate an average or peak of daily counts. In WHERE, a one-value subquery can supply a calculated benchmark instead of a hard-coded threshold.
When checking a multi-stage metric, run the inner query separately, name the grain of each result set, and ask which zero or NULL values enter the calculation. Next, you’ll compare each row with its related group using a correlated subquery.