Recommended resources
The freely available resources this lesson will direct you to.
Hello! Welcome back to your course on SQL for product designers.
Introduction
In our last lesson, you mastered the core aggregate functions—SUM(), AVG(), MIN(), and MAX()—to calculate summary statistics for an entire dataset. You can now answer questions like, "What was the total time spent in our app yesterday?" or "What is the average number of tasks completed per user?"
However, as a product designer, you often need more granular insights. A single, top-level metric can hide important variations within your user base. You don't just want the overall average; you want to know the average for iOS users versus Android users, or for new users versus power users.
This is where today's lesson comes in. We will focus on one of the most powerful clauses in SQL: GROUP BY. By the end of this lesson, you will be able to group aggregated data to analyze metrics across different segments (e.g., by country, by device type). This skill is fundamental to product analytics, as it allows you to slice your data and compare user behavior across different cohorts, features, and platforms.
1. The Core Concept: Split-Apply-Combine
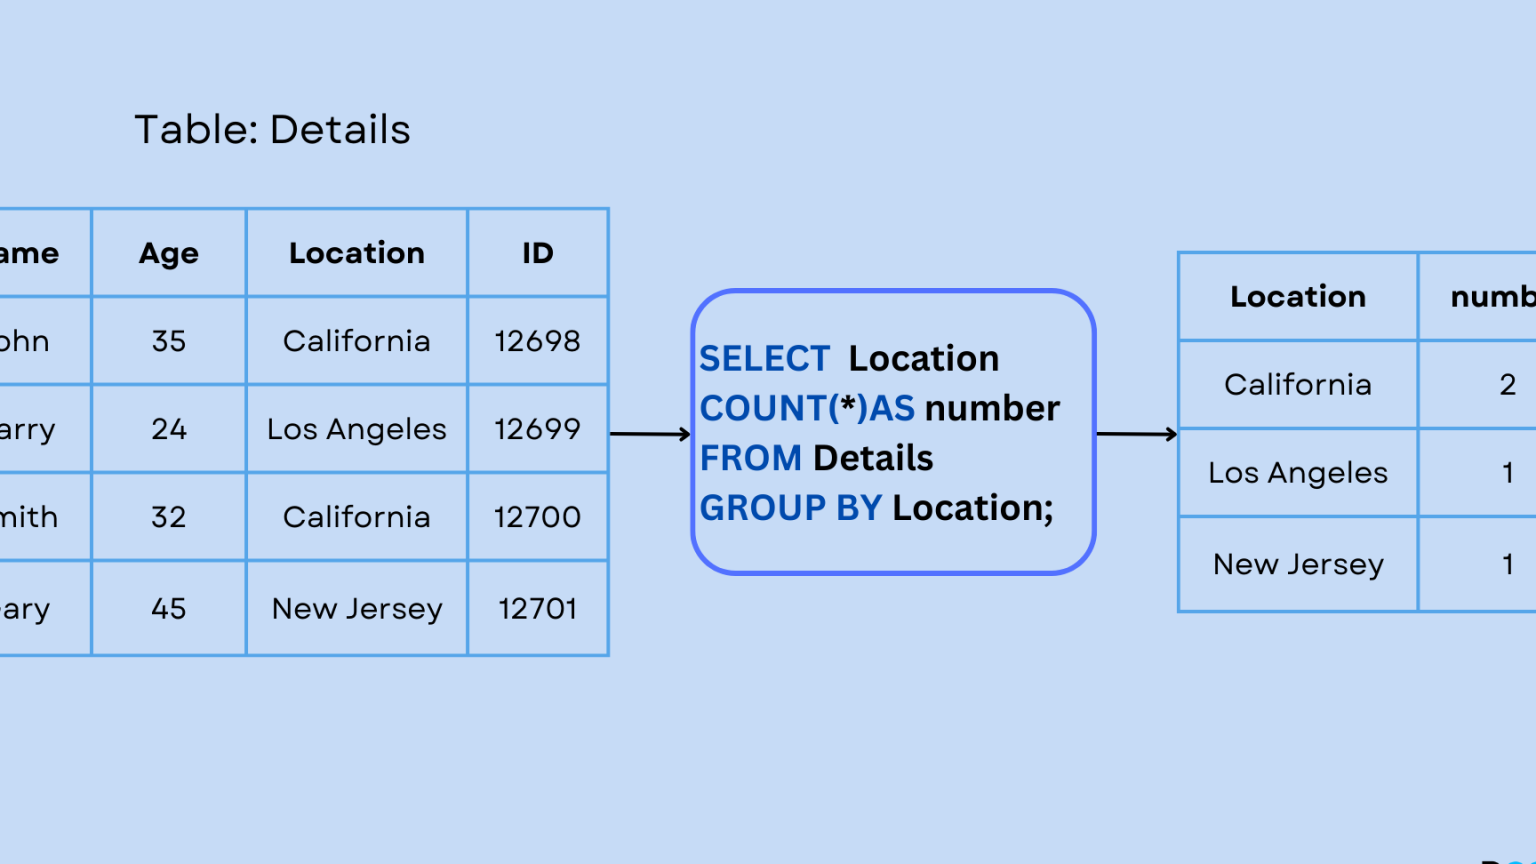
Before we write any code, let's build a mental model for what GROUP BY does. The process can be broken down into three simple steps, often called "Split-Apply-Combine."
How to Use GROUP BY and HAVING in SQL
This brief section from a DataCamp tutorial introduces the "Split-Apply-Combine" framework. It's an excellent way to conceptualize how GROUP BY works.
Read the introductory section under "Using SQL GROUP BY". Focus on understanding the three phases: Split, Apply, and Combine.
To visualize this:
- Split: SQL first conceptually splits your table into smaller groups based on the unique values in the column(s) you specify.
- Apply: It then runs your aggregate function (like
COUNT()orAVG()) independently on each of these smaller groups. - Combine: Finally, it combines the results from each group into a single summary table.
This diagram provides a clear visual of the process:
2. The Mechanics of GROUP BY
Now that you have the conceptual model, let's dive into the syntax and rules. The following video provides a clear, step-by-step guide to writing GROUP BY queries.
Group By + Order By in MySQL | Beginner MySQL Series
This video from Alex The Analyst is a great practical introduction. It covers the basic syntax, how to group by single and multiple columns, and a very important rule about which columns you can select.
Please watch from the beginning to 05:48. Pay close attention to: The basic syntax for grouping by a single column (gender). The error that occurs when you try to SELECT a column that isn't in the GROUP BY clause and isn't part of an aggregate function (01:08). This is the most common mistake beginners make! How to group by multiple columns (occupation and salary) to get more granular segments (03:04).
Key Syntax and Rules Summary
Let's recap the crucial points from the video:
-
Basic Syntax:
SELECT category_column, AGGREGATE_FUNCTION(value_column) AS alias FROM your_table GROUP BY category_column; -
The Golden Rule of
GROUP BY: Any column in yourSELECTlist must either be part of an aggregate function (likeCOUNT(),AVG()) or be listed in theGROUP BYclause. If you violate this rule, the database won't know which specific row's value to show for the entire group, and it will return an error. -
Grouping by Multiple Columns: You can create more specific segments by listing multiple columns in your
GROUP BYclause.SELECT device_type, browser, COUNT(user_id) AS number_of_users FROM sessions GROUP BY device_type, browser;This query would give you the user count for every combination of device and browser (e.g., mobile/Safari, desktop/Chrome, etc.).
3. GROUP BY in a Product Context
Now, let's see how this applies directly to the kind of analysis you'd do as a product designer. We'll move from abstract examples to a real-world business question.
Data Science SQL Mock Interview - Analyze Marketing Channels
This clip from a mock data science interview at Exponent shows how GROUP BY is used to solve a typical business problem: analyzing marketing channel performance. This is a perfect example of segmentation.
Watch from 02:52 to 04:26. Notice how the analyst immediately identifies GROUP BY as the right tool to calculate the average purchase value for each marketing channel.
The example in the video is a classic use case. Instead of one overall "average purchase value," the analyst segments the data by marketing_channel to see which channels are driving the most valuable customers. As a product designer, you would do the same for product-related dimensions:
GROUP BY feature_nameto see which features are used most often.GROUP BY user_segmentto compare the behavior of 'new users' vs. 'power users'.GROUP BY device_typeto understand if the user experience differs between mobile and desktop.
The following reading provides more clear, tabular examples of how the data is transformed.
SQL GROUP BY Statement Explained with Examples
This article from DbSchema provides simple, clear tables that show the 'before' and 'after' of a GROUP BY query. This is great for reinforcing your understanding.
Review the sections "Use SQL GROUP BY on a Single Column", "Use SQL GROUP BY on Multiple Columns", and "GROUP BY with Aggregations". Focus on how the raw 'Sales' table is transformed into the summarized result tables.
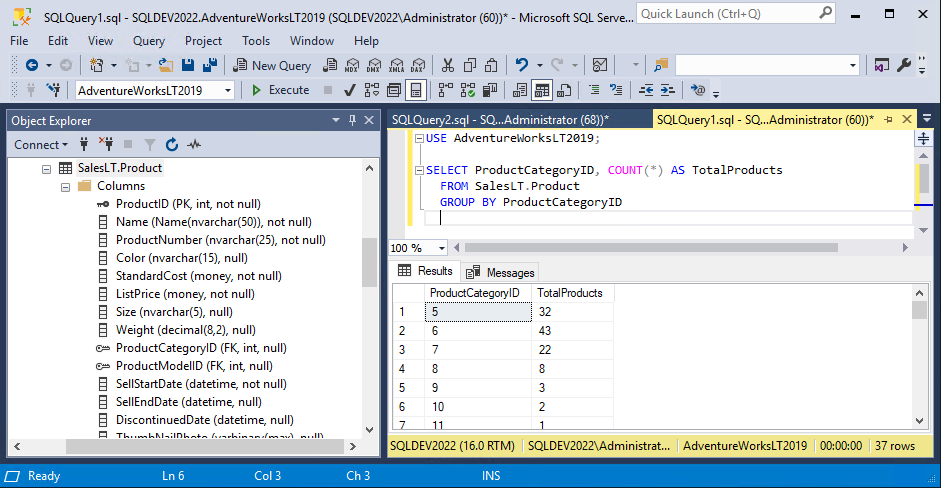
And here is what a GROUP BY query and its results look like inside a real SQL editor, which should feel familiar given your experience with tools like Metabase.
4. Practice: Segmenting User Engagement
You are a product designer for a streaming service. You have a table called viewing_history with the following schema:
user_id(Integer)session_date(Date)device_type(Text: 'mobile', 'desktop', 'tv')content_type(Text: 'movie', 'series')minutes_watched(Integer)
Your team wants to understand viewing patterns better. Write one SQL query for each of the following questions.
- How many total minutes have been watched on each
device_type? - What is the average viewing session duration (
minutes_watched) for 'movies' versus 'series'? - On the date '2024-11-05', how many unique users watched content on each
device_type?
Click to see the solutions
- Total minutes watched per device type:
SELECT device_type, SUM(minutes_watched) AS total_minutes_watched FROM viewing_history GROUP BY device_type; - Average session duration per content type:
SELECT content_type, AVG(minutes_watched) AS avg_session_minutes FROM viewing_history GROUP BY content_type; - Unique users per device on a specific date:
Notice howSELECT device_type, COUNT(DISTINCT user_id) AS unique_users FROM viewing_history WHERE session_date = '2024-11-05' GROUP BY device_type;WHEREis used to filter the data before it gets grouped.
Conclusion
Excellent work! You've now unlocked one of the most essential capabilities in SQL for data analysis. By combining aggregate functions with GROUP BY, you can move beyond simple, one-dimensional metrics and start performing powerful segmented analysis to understand your users on a much deeper level.
Key Takeaways:
GROUP BYis used to segment data and calculate metrics for each segment.- It works using a Split-Apply-Combine strategy: splitting the data into groups, applying an aggregate function to each, and combining the results.
- The Golden Rule: Any column in
SELECTmust either be aggregated (e.g.,SUM(column)) or be in theGROUP BYclause. - You can group by multiple columns to create more granular segments.
WHEREfilters rows before grouping, whileGROUP BYaggregates the filtered rows.
Next Lesson Preview:
In previous lessons, you learned how to use JOIN to combine data from multiple tables. Today, you learned how to use GROUP BY to aggregate data within a single table. The next logical step is to put these two powerful concepts together.
In our next lesson, we will explore how to combine joins with aggregate functions. This will enable you to answer complex, cross-table questions like, "What is the average number of events performed by users from each country?" or "What is the total revenue generated by users who signed up in the last month?" This is where your SQL skills will truly start to shine.