Recommended resources
The freely available resources this lesson will direct you to.
Welcome to the final lesson of your course on mastering the system layer for LLMs. Over the past several modules, we have journeyed from the fundamentals of tokenization and GPU architecture all the way to building a sophisticated, resilient, end-to-end deployment pipeline. In our last lesson, you created a self-healing system by configuring automated rollbacks triggered by live SLO violations, closing the loop between observability and deployment.
Today, we will address the capstone learning outcome: to document the pipeline, deployment strategy, and monitoring setup for a new model. This may seem less technical than our previous hands-on lessons, but it is arguably one of the most critical skills for a senior LLM Ops or SRE role. Effective documentation is the bedrock of scalability, team collaboration, governance, and operational excellence. It transforms a complex system from a personal project into a durable, enterprise-grade asset.
This lesson will provide a structured framework for creating comprehensive documentation that captures the "what, why, and how" of the LLM service you've learned to build.
1. The "What" and "Why": Creating a Model Card
Before diving into the technical runbook, it's essential to document the model itself. A Model Card is a standardized document that provides context about a machine learning model for a wide range of stakeholders, from engineers to product managers and compliance officers. It's the model's "identity card."
The video below introduces the concept of model cards, explaining their purpose and the key sections they should contain.
Model cards with vetiver for transparent, responsible reporting
Watch this screencast from Posit PBC titled "Model cards with vetiver for transparent, responsible reporting." It provides a clear and practical introduction to creating these vital documents.
Please focus on the following sections: Introduction: Understand what model cards are and their role in responsible AI. Model Card Template: Pay close attention to the key sections presented: Model Details, Intended Use, Factors, Metrics, and Data. This provides a great starting structure. Quantitative Analysis: Note the emphasis on not just overall performance, but disaggregated metrics (e.g., performance across different user groups). This is crucial for fairness. Ethical Considerations: Learn about documenting ethical implications, caveats, and recommendations for the model's use.
Based on the video, a good model card for an LLM should include:
- Model Details: Model name (e.g.,
Llama-3-8B-Instruct), version, source (e.g., Hugging Face), architecture type, and any fine-tuning details. - Intended Use: The primary business purpose, target users (e.g., internal support agents), and explicitly stated out-of-scope uses.
- Evaluation: The datasets used for evaluation (e.g., MMLU, custom datasets), key performance metrics (e.g., latency, throughput, perplexity, semantic relevance scores), and crucially, disaggregated analysis showing performance across different data slices.
- Limitations & Biases: Known failure modes, potential biases identified during testing, and ethical considerations.
- Recommendations: Guidelines for using the model responsibly.
2. The "How": The Deployment and Operations Runbook
While the Model Card explains the model, the Runbook explains the system that serves it. This is the core technical document for your engineering and SRE colleagues. It's the blueprint of your entire pipeline. Your extensive experience with infrastructure automation makes this a natural place to apply your skills in formal documentation.
We will structure our runbook based on standard SRE practices, incorporating the LLM-specific elements we've covered throughout this course. The Table of Contents shown in the image below provides an excellent, traditional structure for such a document.

Here are the essential sections for your LLM service runbook:
I. System Overview
- System Summary: A brief, one-paragraph description of the service's function (e.g., "This service provides a real-time, low-latency API for a
Llama-3-8Bmodel, optimized for question-answering tasks."). - Architecture Diagram: A high-level diagram illustrating the entire LLMOps pipeline. This is where you visually connect all the pieces. The article "LLMOps Pipeline Architecture Explained Simply" provides a great checklist for what this diagram should include.
LLMOps Pipeline Architecture Explained Simply
This article provides a concise overview of the components of an LLMOps pipeline.
Focus on two key parts: High-Level End-to-End Architecture Diagram: Read the list of "Canonical layers" to understand the components of the system. Practical Checklist and Diagram Items to Create Today: Use the list under "Diagram elements to include" as a checklist for your architecture diagram. It should show the flow from the dev environment to the model registry, CI/CD, orchestrator, inference cluster, and monitoring.
Your diagram should explicitly show tools like Kubernetes, Argo CD/Rollouts, Prometheus, and Alertmanager in their respective roles.
II. Deployment Strategy
This section details the entire release process, from code commit to production rollout.
- CI/CD Pipeline: Describe the steps triggered by a
git push:- CI (Continuous Integration): Linting, unit tests, building container images, running automated evaluation benchmarks against the model artifact.
- CD (Continuous Deployment): Pushing artifacts to a registry, updating the GitOps repo, which Argo CD then syncs to the cluster.
- Release Engineering:
- Strategy: Canary Rollout using Argo Rollouts.
- Traffic Management: Describe how traffic is split (e.g., 10% -> 25% -> 50% -> 100%) and the duration of each step.
- Automated Quality Gates: Detail the
AnalysisTemplateused during the canary, specifying the metrics (e.g., P99 latency, error rate) and thresholds that must be met to proceed. - Automated Rollback (During Deployment): Explain that the canary will automatically roll back if the analysis fails.
- Post-Deployment Reliability:
- Mechanism: Explain the live SLO monitoring via Prometheus and Alertmanager.
- Trigger: Describe how a
criticalalert (e.g., for an SLO breach) fires a webhook. - Action: Explain that the webhook triggers an automation endpoint that executes
kubectl argo rollouts undo <rollout-name>to revert to the last known stable version.
III. Observability & Monitoring Setup
This section provides a complete picture of how you monitor the health and performance of the service.
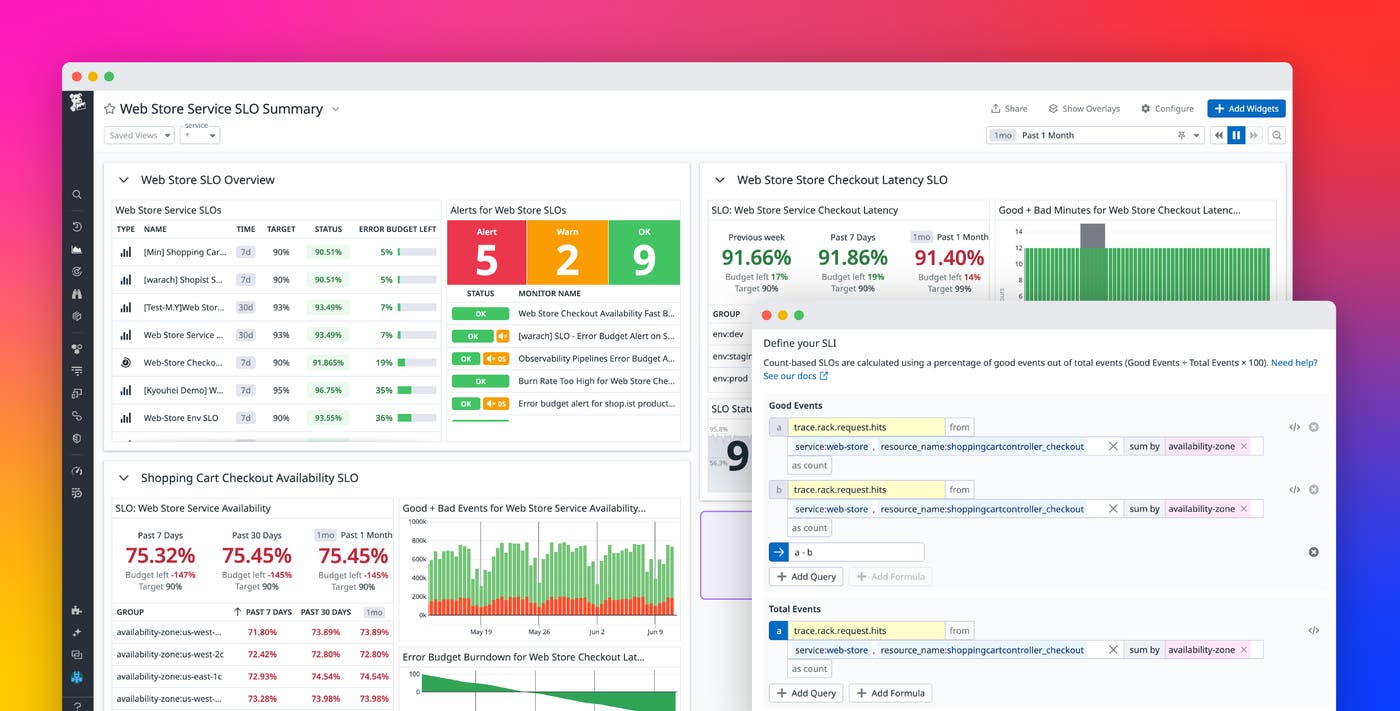
- Key Metrics (SLIs): List the critical Service Level Indicators you are tracking. For an LLM, this includes:
- Performance:
vllm_e2e_request_latency_seconds,vllm_generation_throughput_tokens_per_second. - GPU Utilization:
DCGM_FI_DEV_GPU_UTIL,DCGM_FI_DEV_FB_USED. - Cost/Usage: Per-request input/output token counts.
- Quality: Semantic relevance scores, hallucination detectors (if applicable).
- Performance:
- Service Level Objectives (SLOs): Define the precise targets for your key metrics.
- Availability: > 99.9% success rate (non-5xx responses).
- Latency: P99 e2e request latency < 1500ms.
- Quality: Average semantic relevance score > 0.85 over a 1-hour window.
- Dashboards: Provide links to the Grafana or Datadog dashboards built to visualize these metrics. Describe the key panels on the main dashboard (e.g., SLO status, GPU cluster view, cost-per-request tracking).
- Alerting:
- Describe the Prometheus alerting rules (
HighP99RequestLatency,HighErrorRate). - Explain the Alertmanager routing logic (e.g.,
severity: critical-> webhook,severity: warning-> Slack).
- Describe the Prometheus alerting rules (
- Tracing: Explain how OpenTelemetry is configured to provide end-to-end traces for each request, and what key attributes are attached to spans (e.g.,
model_name,request_id,input_tokens,output_tokens).
The demo from the Databricks talk on MLOps provides a great visual for how traces and monitoring artifacts look in a real system.
Exploring MLOps and LLMOps: Architectures and Best Practices
This video, "Exploring MLOps and LLMOps", includes a practical demo of a RAG application.
Review the demo starting at the practical demonstration. Focus on how they use MLflow traces (MLflow Traces) to debug and optimize the chain. Your documentation should explain how an engineer would use a similar tracing tool to diagnose a problem in your pipeline.
IV. Governance and Incident Response
Finally, your documentation should align with broader governance and operational needs.
- Governance Artifacts: The "AI Governance Best Practices" article highlights the need for standardized documentation. Your runbook and model card are primary examples.
AI Governance Best Practices: Frameworks & Principles - Databricks
This article from Databricks explains how to build a practical AI governance program.
Skim the sections on Standardize Governance Artifacts and Preparing for Future AI Governance Requirements. Notice how documents like "System Summaries," "Evaluation Records," and "Monitoring Plans" are listed. Your runbook serves all these purposes.
- Operational Playbooks: For SREs, list brief, high-level steps for common incidents.
- Incident: High Latency Alert:
- Check Grafana dashboard for GPU utilization and batch size.
- Inspect traces in Jaeger/Datadog to see which part of the process is slow (e.g., prefill vs. decode).
- If a new model was just deployed, initiate manual rollback:
kubectl argo rollouts undo ...
- Incident: Quality Degradation Alert:
- Check logs for a spike in a particular type of user input.
- Review evaluation benchmarks for the current model version.
- Engage the data science team to analyze the problematic prompts.
- Incident: High Latency Alert:
Conclusion
Congratulations! You have reached the end of the course. By learning to document your work, you are solidifying your expertise and making it accessible and actionable for your entire organization. This is the hallmark of a senior engineer who builds not just systems, but sustainable and scalable platforms.
Key Takeaways:
- Documentation is Two-Part: It consists of the Model Card (the what/why) for a broad audience and the Deployment Runbook (the how) for technical teams.
- A Runbook is a Blueprint: It should contain a system overview, a detailed deployment strategy, a comprehensive monitoring plan, and operational playbooks.
- Connect to a Single Source of Truth: Your documentation should live in accessible places (e.g., Git repo README, Confluence) and link directly to dashboards, code, and other resources.
- Documentation Enables Governance: Clear, standardized documentation is the foundation for responsible AI governance, providing the evidence needed for audits, risk assessments, and compliance.
You have built an incredible skill set, progressing from the lowest level of GPU operations to the highest level of strategic pipeline management. The ability to design, build, deploy, monitor, and now document these complex systems places you at the forefront of the LLM Ops field.