Recommended resources
The freely available resources this lesson will direct you to.
Hello! Welcome to the final lesson in our module on architecting a ZTNA solution.
In our previous lesson, we designed a powerful micro-segmentation enforcement model using identity-aware proxies and dynamic network policies. This created a system where every application is protected by its own identity-aware security controls, enforcing the decisions made by our ZTNA control plane. We have now designed all the major logical components of our ZTNA service.
However, as a software engineer, you know that designing a distributed system's features is only half the battle. A system that isn't reliable, resilient, and understandable under failure is incomplete. This lesson addresses that critical operational dimension.
Today, we will focus on fulfilling the learning outcome: Architect for high availability and observability in a distributed ZTNA solution, considering connector placement and key metrics. We will explore how to build our ZTNA service to withstand failures and how to gain deep insights into its health and performance.
1. High Availability: The Foundation of Trust
A security service that isn't available is not secure. For a ZTNA solution that mediates all access, high availability (HA) is non-negotiable. The architectural cornerstone that enables this is the principle we've discussed throughout this module: the separation of the control plane and the data plane. Let's solidify our understanding of why this separation is so crucial for resilience.
Control Plane vs. Data Plane in Modern ZTNA Platforms
The article 'Control Plane vs. Data Plane in Modern ZTNA Platforms' by TerraZone provides an excellent analysis of how this architectural split directly enables high availability.
Please read the following sections: 'Why This Matters in Modern ZTNA Platforms': Focus on the concepts of 'Security Isolation' and 'Failure Resilience'. 'Security Advantages of Control/Data Plane Separation': Pay attention to 'Independent Failure Domains'. 'Performance Considerations in Control vs. Data Plane': Understand how the performance of each plane impacts the user experience differently. \nAs you read, consider how a failure in one plane (e.g., the control plane is slow) might affect the user experience without necessarily bringing the entire system down.
This separation creates independent failure domains, which is the key to building a resilient system. An issue with policy evaluation shouldn't stop existing traffic from flowing. Let's now architect the HA strategy for each part of our system.
Control Plane High Availability
The control plane is the "brain" of our ZTNA solution; it handles authentication, device posture checks, and policy decisions. If the control plane is down, new user sessions cannot be established.
Our HA strategy for the control plane involves:
- Redundancy within a Region: The control plane services (policy engine, etc.) should be deployed as multiple instances across different Availability Zones (AZs) within a cloud region, placed behind a load balancer. This protects against a single server or AZ failure.
- Geo-Redundancy across Regions: For disaster recovery, a multi-region deployment is necessary. This can be an active-passive setup, where one region takes over if the primary fails, or an active-active setup where both regions serve traffic. This requires a robust data replication strategy for policies, user data, and session information.
- Graceful Degradation: The most important outcome of control plane failure is that existing, active user sessions managed by the data plane should continue to function without interruption. This is the "graceful degradation" mentioned in the article. Users who are already working can continue; only new logins are affected.
Data Plane High Availability
The data plane consists of the distributed proxies or gateways that handle the actual user traffic. Their performance and availability directly impact the user experience.
Our HA strategy for the data plane is built on distribution:
- Global Points of Presence (PoPs): The data plane nodes are deployed in dozens or hundreds of PoPs around the world, close to major internet exchanges.
- Anycast Routing: BGP Anycast is used to advertise the same IP address from all PoPs. This allows user traffic to be automatically routed to the topologically nearest (and thus lowest-latency) PoP.
- Automatic Failover: If an entire PoP becomes unavailable, BGP automatically withdraws the route from that location, and traffic is seamlessly redirected to the next-nearest healthy PoP without any manual intervention. Within each PoP, standard load balancing across multiple proxy instances ensures resilience.
Connector High Availability
Connectors are the crucial components you deploy within your private network or VPC to provide the outbound-only bridge to your internal applications. A single connector is a single point of failure for all applications it services.
Our HA strategy for connectors focuses on redundant, scalable deployments.
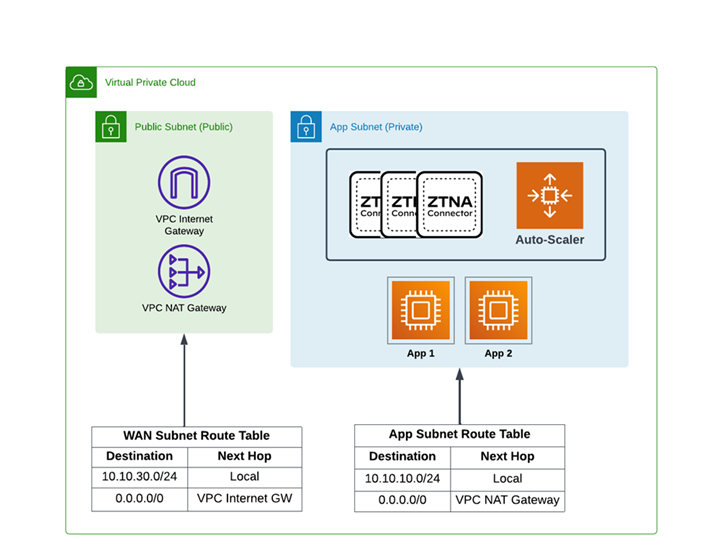
Let's break down this architectural pattern:
- Multiple Instances: At least two connectors are deployed to avoid a single point of failure.
- Multiple Availability Zones: These connectors are placed in different AZs. If one AZ has an outage, the connector in the other AZ can still service traffic.
- Auto-Scaling Group: The connectors are managed by an auto-scaling group. This ensures that if an instance fails a health check, it's automatically terminated and replaced. It also allows the number of connectors to scale horizontally based on traffic load (e.g., scaling out if average CPU utilization exceeds 70%).
The control plane is responsible for monitoring the health of all registered connectors and will only direct traffic to healthy, active instances.
2. Architecting for Observability
A highly available system is great, but if you can't understand what it's doing or why it's failing, it's unmanageable. Observability is the practice of instrumenting a system to provide high-fidelity data that allows you to ask arbitrary questions about its state and debug novel problems.
For our ZTNA solution, this means being able to answer questions like:
- Why was this specific user denied access to this app at 3 PM yesterday?
- Is the recent increase in application latency caused by our policy engine or a specific data plane node?
- Which applications are seeing the most failed access attempts?
Let's design a framework for this, starting by understanding what can go wrong and what metrics we need to capture.
What is Zero Trust? Meaning, Architecture, Examples, Use Cases ...
The 'What is Zero Trust?' article from DevSecOps School provides two incredibly useful tables that give us a ready-made blueprint for ZTNA observability. The first table outlines potential failures and the signals to detect them, while the second defines specific metrics and SLIs.
Please study the two tables in this resource carefully: 'Failure modes & mitigation' table: This is our guide to what can break. For each failure mode, pay close attention to the 'Symptom' and the 'Observability signal'. This tells us what to look for. 'Metric/SLI' table: This is our instrumentation plan. It provides a list of concrete Service Level Indicators (SLIs) to measure the health of our system. Focus on metrics like 'Authz success rate', 'Decision latency p95', and 'Time to revoke access'. \nThese tables provide the raw material for building our monitoring dashboards and alerts.
The tables you just reviewed give us a rich set of signals. Let's organize them into a practical observability architecture.
Key Metrics and SLIs by Component
We need to collect metrics from every part of our distributed system and visualize them on dashboards.
Control Plane Health:
These metrics tell us about the health of our "brain."
- Authorization Success/Error Rate (SLI M1, M2): The percentage of policy evaluations that succeed or result in an error. A spike in errors indicates a problem with the policy engine itself.
- Decision Latency p95 (SLI M3): The 95th percentile time it takes for the policy engine to make an access decision. A rising latency here will directly translate to slower login times for users and is a lead indicator of performance degradation.
- Time to Revoke Access (SLI M5): Measures the delay between a revocation command (e.g., an admin terminating a session) and its enforcement. This is a critical security metric.
Data Plane & Connector Health:
This is where we monitor the components handling the actual traffic. A dashboard for a ZTNA connector would look something like this:
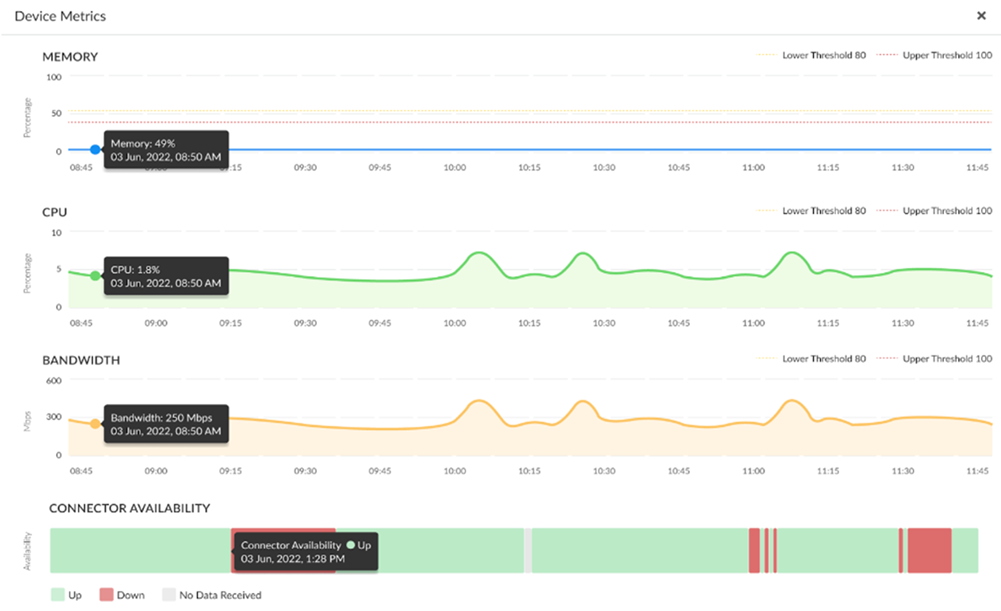
These visuals are driven by key metrics:
- Resource Utilization: CPU and Memory usage of data plane proxies and connectors. Sustained high usage can indicate a need to scale up or out.
- Bandwidth/Throughput: The volume of traffic being processed. This is crucial for capacity planning and identifying unusual traffic patterns.
- Connection Latency: Time to establish a new tunnel through the data plane.
- Availability: Simple uptime/downtime tracking for each connector and data plane PoP.
Logging for Security and Debugging
While metrics tell you what is happening, logs tell you why. A robust logging strategy is essential for both security forensics and operational debugging.
- Control Plane (Audit Logs): Every single access decision must be logged in a structured, immutable format. A typical log entry should include:
- Timestamp
- Source User Identity (e.g., user email)
- Source Device ID & Posture (e.g., OS version, compliant/non-compliant)
- Source IP & Geolocation
- Target Application
- Policy Decision (Allow/Deny)
- Reason for Decision (e.g., "Policy 'X' matched", "Device posture failed check Y")
- Data Plane (Traffic Logs): These logs capture metadata about the traffic flow, such as source/destination IPs, protocol, and bytes transferred. For privacy and cost reasons, full packet capture is rare; metadata is usually sufficient.
- Correlation IDs: This is a crucial system design concept. A single unique ID should be generated at the start of a user's request and propagated through every component it touches: client agent -> data plane proxy -> control plane -> connector. When a user reports an issue, you can use this one ID to trace their request's entire lifecycle across all system logs, making debugging vastly simpler.
By combining metrics, logs, and traces under a unified observability platform, you can build powerful dashboards for real-time monitoring and configure intelligent alerts to notify your engineering teams when key SLIs are at risk of being breached.
Conclusion
In this lesson, we've fortified our ZTNA design by architecting for the critical non-functional requirements of high availability and observability.
Key Takeaways:
- High availability in ZTNA is fundamentally enabled by the architectural separation of the control and data planes, which creates independent failure domains.
- Resilience is achieved through redundancy at every layer: geo-replicated control planes, globally distributed data plane PoPs using Anycast, and auto-scaled, multi-AZ connector groups in the private network.
- A robust observability strategy is built on understanding potential failure modes and defining clear Service Level Indicators (SLIs) to monitor system health.
- Key metrics track the availability, latency, and error rates of the control plane, and the resource utilization and throughput of the data plane and connectors.
- Centralized, structured logging with correlation IDs is indispensable for both security auditing and operational debugging of a complex, distributed system.
This lesson concludes our module on architecting a ZTNA solution. We have journeyed from the initial connection flow to the intricate details of policy enforcement, continuous authentication, and now, operational robustness.
Preview of the Next Module:
You now have a deep, first-principles understanding of the architectural patterns that underpin a modern ZTNA service. In our next module, Architecting a Web Application Firewall (WAF), we will see how many of these same core concepts—like proxies, policy engines, and distributed inspection—are adapted to solve a different but equally important security problem: protecting web applications from direct attack.