Recommended resources
The freely available resources this lesson will direct you to.
Hello! Welcome back to our final lesson in the "Advanced Architecture and Optimization" module.
In our previous lesson, we explored general-purpose techniques for profiling server-side code, focusing on identifying CPU and memory bottlenecks. That lesson gave you the "how" of performance investigation. Today, we'll focus on a specific and crucial "what": Time to First Byte (TTFB).
TTFB is one of the most important metrics for a server-rendered application because it directly measures your server's responsiveness. A slow TTFB leads to a blank screen for the user, undermining the very performance benefits we seek with SSR.
This lesson will teach you how to measure and optimize TTFB for your server-rendered pages. We will dissect what contributes to TTFB, learn how to measure it accurately, and explore powerful optimization strategies, including caching and streaming, that you can apply directly in your Tanstack Start application.
1. What is Time to First Byte (TTFB)?
At its core, TTFB measures the time from when a user initiates a request (e.g., clicks a link) to when the very first byte of the response arrives at their browser. It's a fundamental measure of both network latency and server processing speed.
To get a solid foundation, let's start with a video that defines TTFB and its place within the broader landscape of web performance metrics.
Frontend System Design: The 2025 Web Performance Roadmap
This segment from the "Frontend System Design: The 2025 Web Performance Roadmap" video by Dmitriy Zhiganov clearly defines TTFB and explains why it's a critical starting point for performance optimization.
Watch from 14:01 to 17:37. Focus on how TTFB is defined as the sum of the first three steps of the loading process and what Google considers a 'good' TTFB score.
As the video explained, a high TTFB directly increases other critical metrics like First Contentful Paint (FCP) and Largest Contentful Paint (LCP). You can't have a fast-painting site if the server takes a long time to send the initial data.
Breaking Down TTFB
TTFB isn't a single, monolithic value. It's the sum of several distinct phases. Understanding these phases is key to knowing where to focus your optimization efforts.
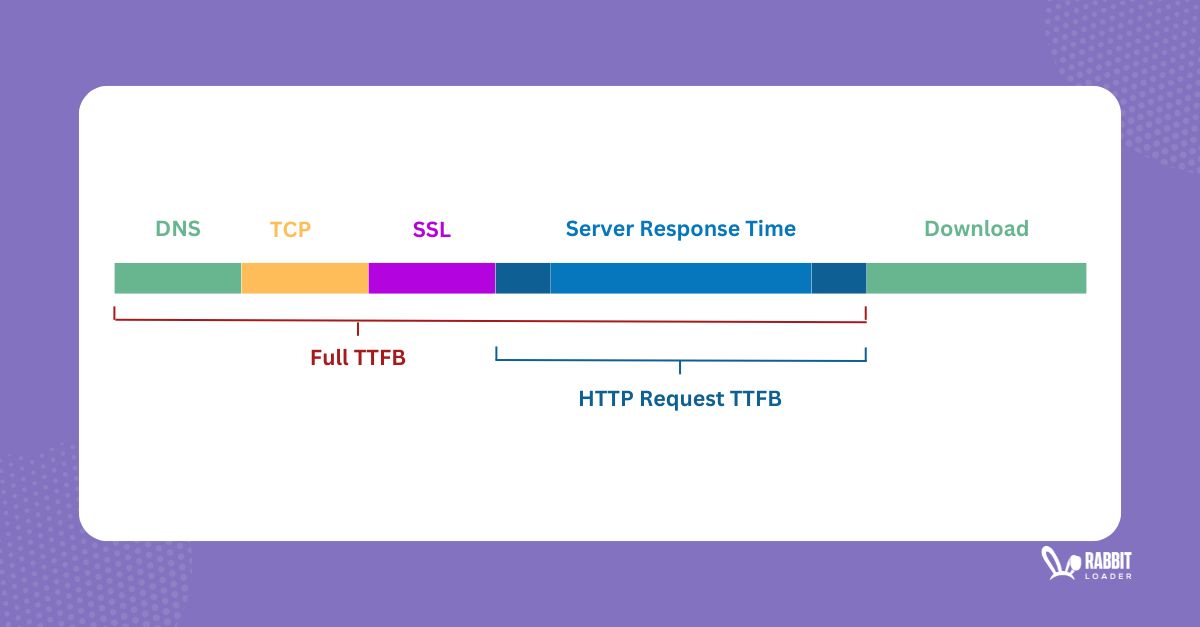
The corewebvitals.io article, "What is the Time To First Byte (TTFB) and how to improve it," provides an excellent breakdown of these stages.
What is the Time To First Byte (TTFB) and how to improve it
This article offers a deep dive into TTFB. We'll read the sections that define the metric, explain its importance, and break down its constituent parts.
Please read the following sections: What is the Time to First Byte: A concise definition. Why is Time to First Byte important: Understand its impact on user experience. What is a good TTFB score?: Get familiar with the performance benchmarks (~800ms). The TTFB from request to response: This gives a high-level view of the three main stages. Technical stages of the Time To First Byte: This provides a more granular, technical breakdown (Redirect, DNS, TCP, etc.). Focus on the distinction between network-related delays (DNS, TCP/SSL) and server-side delays (server processing).
As you've read, while factors like DNS lookup and network latency contribute to TTFB, the part you have the most control over as an application developer is the server processing time—the time your server spends handling the request, running your route loader, and rendering the React component tree to HTML.
2. How to Measure TTFB
Before you can optimize, you must measure. There are several ways to measure TTFB, each suited for different contexts.
Lab Measurement: Chrome DevTools
For development, the quickest way to check TTFB is using the Network tab in Chrome DevTools.
- Open DevTools (
F12orCtrl+Shift+I). - Go to the Network tab.
- Load or refresh your page.
- Click on the main document request (usually the first entry in the list).
- Go to the Timing tab in the panel that appears.
You will see a detailed breakdown of the request. The value labeled Waiting (TTFB) is what you're looking for.
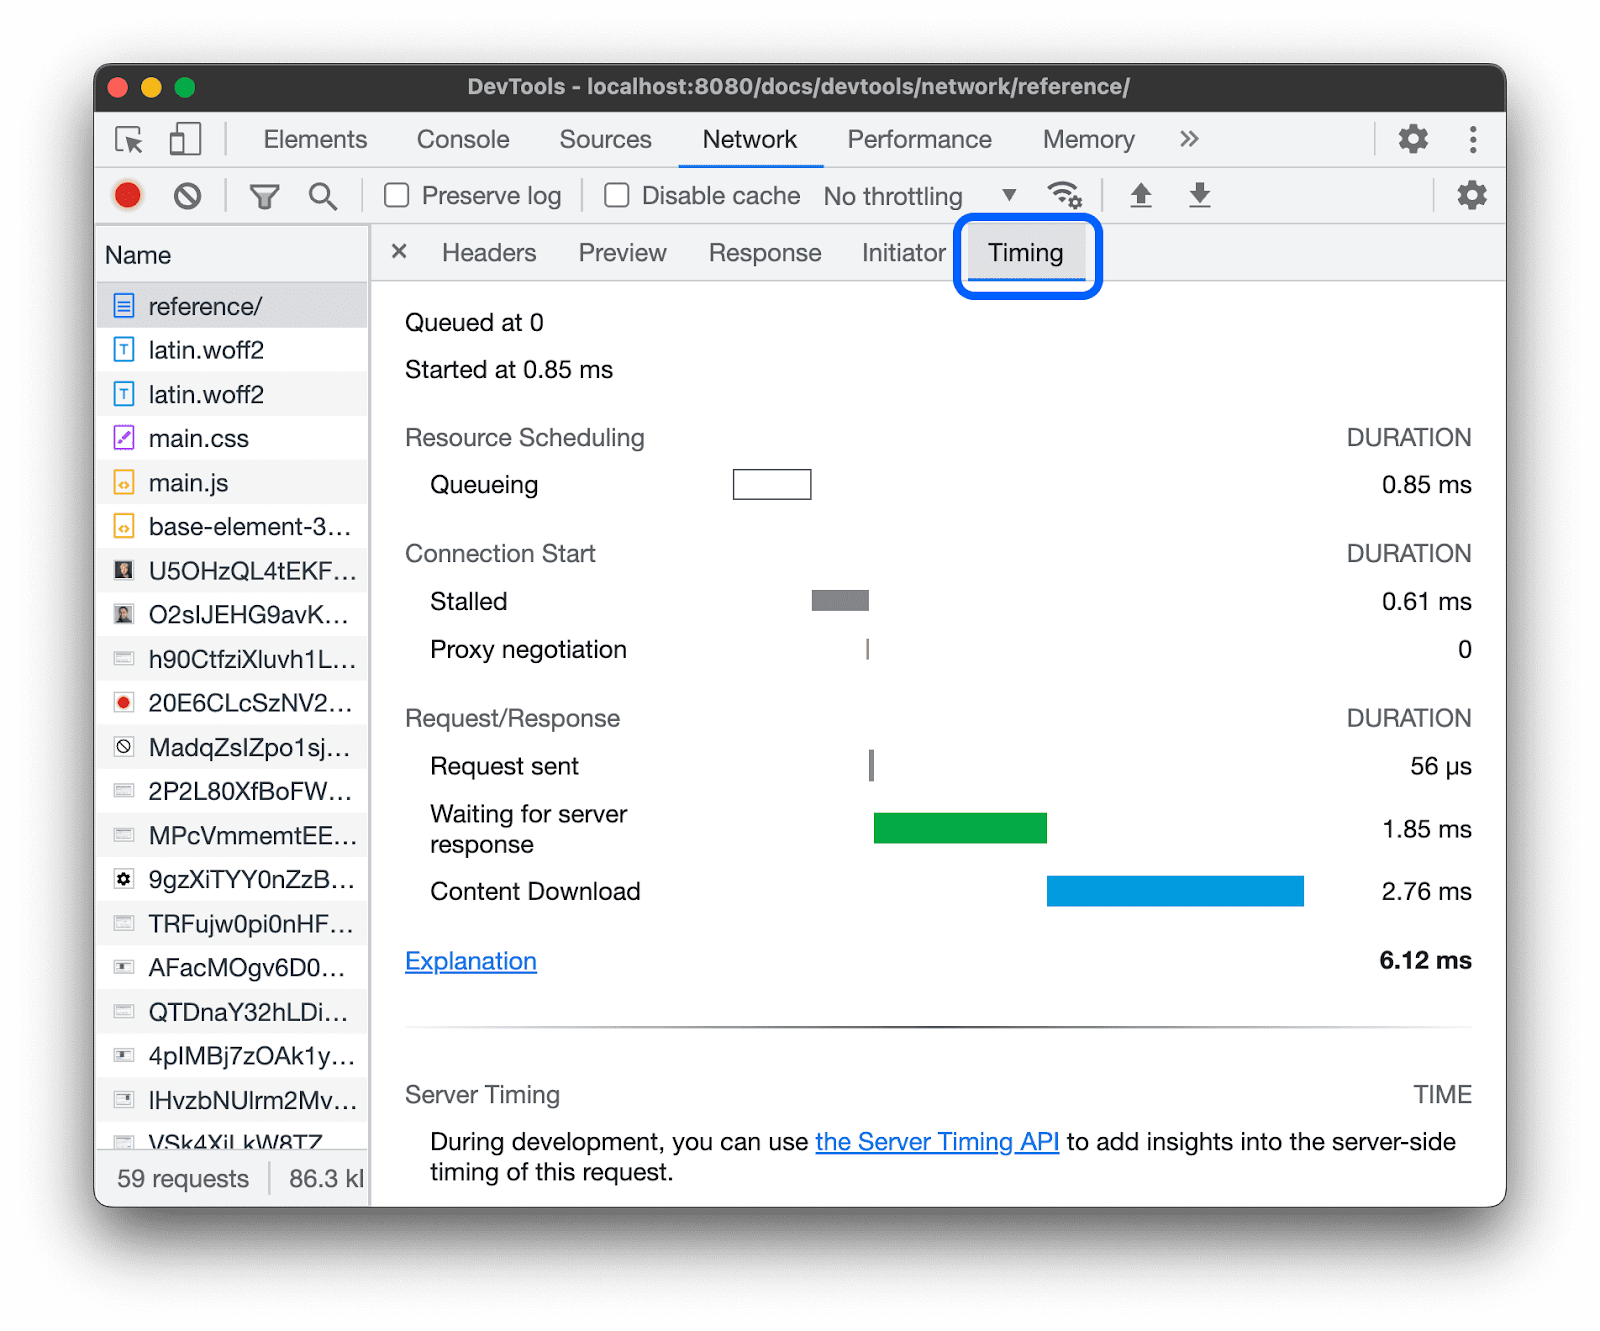
Field Measurement: web-vitals Library
Lab measurements are useful, but they don't capture the experience of your real users, who have different devices, network conditions, and locations. For that, you need to measure in the field. The web-vitals library from Google is the standard way to do this.
You can add it to your project and log the real TTFB values from your users.
// In your client entry file (e.g., entry-client.tsx)
import { onTTFB } from 'web-vitals';

onTTFB(console.log);
// In a real app, you would send this data to an analytics service.
// Example output: {name: 'TTFB', value: 123.45, rating: 'good', id: 'v3-1654321...'}
The web.dev article on TTFB provides the official guidance on measurement.
Time to First Byte (TTFB) | Articles
Let's refer to the official web.dev article for a concise summary of measurement tools and techniques.
Read the section titled "How to measure TTFB". It provides code snippets for using the Navigation Timing API and the web-vitals library, reinforcing what we've just discussed.
3. How to Optimize TTFB
Now for the most important part: making it faster. We'll focus on the two areas with the biggest impact: reducing server processing time and reducing network latency.
The corewebvitals.io article you read earlier has excellent sections on optimization strategies. We'll use it as a guide.
Strategy 1: Reduce Server Processing Time
This is where your application logic lives and where you can make the most significant improvements.
A. Caching
Caching is the most effective TTFB optimization. The goal is to avoid re-computing expensive results.
- Page Caching / Full Page Caching: If a page is the same for all users, you can cache the entire rendered HTML. The web server (like Nginx) or a CDN can then serve this static file instantly, resulting in a minimal TTFB. This is the core idea behind Static Site Generation (SSG).
- Data Caching: In your route loaders, you often fetch data from databases or external APIs. As we covered in a previous lesson, you can use an in-memory cache to store the results of these fetches for a short period. This prevents every user request from hitting your database, drastically reducing processing time for cached responses.
- Database Optimization: Slow database queries are a common cause of high TTFB. Ensure your queries are efficient and that your tables have appropriate indexes for common lookups.
What is the Time To First Byte (TTFB) and how to improve it
Let's review the server-side optimization techniques from the corewebvitals.io article. This will formalize the caching strategies we just discussed.
Read the section "How to improve the TTFB - Speed up the server side". Pay close attention to the descriptions of Page Caching and Partial Caching.
B. Streaming SSR with React Suspense
What if you can't cache a page because it's highly dynamic? If a route loader needs to perform a slow data fetch (e.g., 2 seconds), the server has to wait 2 seconds before it can send any HTML. This is a TTFB killer.
The solution is streaming. The server immediately sends a static "shell" of the page, including loading indicators. This results in a very low TTFB. Then, once the slow data is ready, the server streams the remaining HTML to the client, which React uses to "fill in" the missing content.
This is achieved using React Suspense and is a core feature of modern SSR frameworks. In Tanstack Router, you enable this by providing a pendingComponent for your route.
// src/routes/posts/$postId.tsx

export const Route = createFileRoute('/posts/$postId')({
  component: PostComponent,
  loader: async ({ params }) => {
    // This fetch is slow
    return fetchPost(params.postId);
  },
  // This component will be rendered immediately, resulting in a low TTFB.
  pendingComponent: () => <div>Loading post...</div>,
})
The following video, although using Next.js, demonstrates this exact principle perfectly. The concept is identical.
DON'T Make This Mistake with Next.js Server Components (BAD performance!)
This video by James Q Quick shows the dramatic difference in TTFB when a loading UI is used for a slow server component. This is the same principle as using pendingComponent in Tanstack Router.
Watch from 01:32 to 04:10. First, observe how the slow data fetch without a loading UI results in a poor TTFB. Then, see how adding a loading.tsx file (analogous to our pendingComponent) allows the server to send a response immediately, drastically improving TTFB and FCP.
Strategy 2: Reduce Network Latency with a CDN
The physical distance between your user and your server is a major factor in TTFB. A Content Delivery Network (CDN) solves this by placing copies of your content on servers all around the world. When a user makes a request, it's routed to the nearest server, minimizing latency.
A CDN can:
- Serve static assets (JS, CSS, images) very quickly.
- Cache entire HTML pages at the "edge" (the server closest to the user), providing the fastest possible TTFB.
- Offer highly optimized DNS and connection handling.
What is the Time To First Byte (TTFB) and how to improve it
The corewebvitals.io article also has a great section on how CDNs help with TTFB.
Read the section "How to improve the TTFB - leverage a CDN". Note how a CDN can improve almost every technical stage of the TTFB we identified earlier.
Modern hosting platforms like Vercel (which we'll discuss in the next module) have a global CDN built-in, making this strategy easy to implement.
Conclusion
You've now learned how to tackle one of the most fundamental aspects of web performance. Optimizing TTFB is a high-leverage activity that directly translates to a faster, more responsive experience for your users.
Key Takeaways:
- TTFB is foundational: It measures the time to receive the first byte of a response and sets the floor for all other loading metrics. Aim for under 800ms.
- Measure first: Use Chrome DevTools for lab analysis and the
web-vitalslibrary to capture real user data. - Server processing is your primary target: The time your server spends thinking is often the biggest bottleneck you can control.
- Cache aggressively: Use page caching for static content and in-memory data caching in your route loaders for dynamic content.
- Stream for dynamic content: Use Tanstack Router's
pendingComponentwith React Suspense to avoid blocking the initial render on slow data fetches, ensuring a low TTFB. - Use a CDN: Reduce network latency by serving content closer to your users.
Next Up:
With this deep dive into performance optimization complete, we are ready to move on to the final module: Production Deployment and Monitoring. In our next lesson, we will generate and inspect a production-ready build of a Tanstack Start application, seeing how our optimized code is bundled and prepared for the real world.