Recommended resources
The freely available resources this lesson will direct you to.
- Unit Economics Benchmarks for Two-Sided Marketplaces | From Idea to Exitwww.youtube.com
- SaaS Metrics: LTV, CAC, CAC Payback Periods, and Morewww.youtube.com
- Marketplace metrics: 26 key metrics + how to use themwww.sharetribe.com
- The five accounting metrics for cloud companies - Bessemer Venture Partnerswww.bvp.com
Hello. Last lesson distinguished activity, contracted business, recognized revenue, and margin. This lesson asks a more demanding question: after acquiring a customer or generating a transaction, how much economic value does the business actually keep?
The answer depends on the business model. A subscription vendor must recover the cost of winning an account over its retained life. A marketplace must make each completed transaction worthwhile and sustain both sides of the market. A cloud or AI service may look attractive per request but disappoint if paid-for capacity sits idle. Allow about 45–50 minutes, including the selected video segments and reading.
1. Define the unit before calculating its economics
“Unit economics” is not a single sector-wide formula. It is a way to connect a repeatable unit of activity to the revenue it earns, the cost of delivering it, and—where relevant—the cost of acquiring it.
Choose a unit that matches the decision you are investigating:
| Business | Useful unit | Decision it helps answer |
|---|---|---|
| Subscription software | Customer account or customer cohort | Will retained gross profit repay acquisition spending? |
| Marketplace | Completed order, plus buyer and seller cohorts | Do transactions contribute enough to support acquiring both sides? |
| Payments | Processed transaction or payment volume | How much of the fee remains after payment and risk costs? |
| Cloud or AI service | Workload, request, or capacity cohort | Does utilization cover serving costs and committed capacity? |
A contribution margin subtracts costs attributable to serving the chosen activity from the revenue it generates. Its precise boundary must be stated. Payment fees and transaction-linked support might be included in marketplace contribution; central product research might not be. A cost need not vary with every additional transaction to matter: capacity purchased in blocks is particularly important when assessing whether a cloud service can scale profitably.
Keep three questions separate: Is the activity profitable to serve? Can acquired customers repay their acquisition cost? Will volume be sufficient to cover shared and fixed costs? A positive answer to the first does not guarantee the other two.
2. Subscription software: acquisition must be repaid by retained gross profit
For SaaS, a practical starting point is customer acquisition cost (CAC): relevant sales and marketing spending divided by the new customers attributable to that spending. Include the acquisition effort you intend to evaluate—such as sales compensation and marketing programs—not just advertising invoices. The matching period matters: enterprise selling costs may be incurred well before an account starts paying.
Next estimate the recurring gross profit from a newly acquired customer. Gross margin deducts the costs of delivering the service; it is not the same as revenue. CAC payback asks how long that gross profit takes to recover acquisition spending:
Watch the selected parts of SaaS Metrics: LTV, CAC, CAC Payback Periods, and More from Mergers & Inquisitions / Breaking Into Wall Street. Focus on the choice of costs and the assumptions hidden inside a lifetime-value estimate, rather than adopting a universal “good” ratio.
SaaS Metrics: LTV, CAC, CAC Payback Periods, and More
The video builds the customer-level logic behind SaaS lifetime value, acquisition cost, and payback.
Watch lifetime value for the effects of churn, gross margin, and discounting. Continue with acquisition cost for what belongs in CAC. Then watch CAC payback for the shorter-term test of acquisition efficiency.
Consider an illustrative cohort of 100 newly acquired accounts. Suppose winning them costs million in total, each account pays annually, and the service earns a 75% gross margin. CAC is per account. Monthly gross profit per account is , giving eight months of simple CAC payback.
That calculation is useful, but it assumes the account begins paying promptly and continues doing so through payback. To test longer-term value, suppose 80% of each year’s accounts remain for the following year, retained accounts pay the same amount, and we examine only the first three years. Expected gross profit before CAC, per original account, is:
The resulting three-year gross-profit-to-CAC ratio is . This is an illustrative, undiscounted, three-year measure, not a claim about the customer’s full lifetime or the company’s net profit. If annual retention fell to 60%, the same initial payback calculation would still say eight months, while the three-year ratio would fall to . Payback and lifetime economics answer different questions.
The previous lesson’s retention measures now have a direct economic role. Expansion can improve revenue from retained accounts, but headline net revenue retention can mask churn among smaller customers. Analyze acquisition and retention by cohort and segment where possible; blending a high-retention enterprise segment with a high-churn smaller-customer segment can make the “average customer” economically fictional. Also distinguish the gross-profit-to-CAC ratio used above from a definition of lifetime value that has already subtracted CAC—mixing the two double-counts acquisition cost.
3. Marketplaces: transactions depend on two healthy cohorts
A marketplace has at least two acquisition problems. Buyers need relevant, available supply; sellers need enough successful demand to justify joining and remaining active. That makes liquidity—the likelihood that a suitable match becomes a transaction—part of the economic mechanism, not merely a user-experience statistic.
Watch these excerpts from Unit Economics Benchmarks for Two-Sided Marketplaces | From Idea to Exit by Eric Andrews. They introduce the two-sided acquisition problem, then show why retention and repeat purchasing matter more than an impressive first transaction.
Unit Economics Benchmarks for Two-Sided Marketplaces | From Idea to Exit
The video connects marketplace GMV and take rate to the distinct economics of acquiring and retaining buyers and sellers.
Watch two-sided economics for the hard-side and acquisition considerations. Skip to retention cohorts to see why repeat activity matters, then deteriorating economics for a contrasting growth scenario.
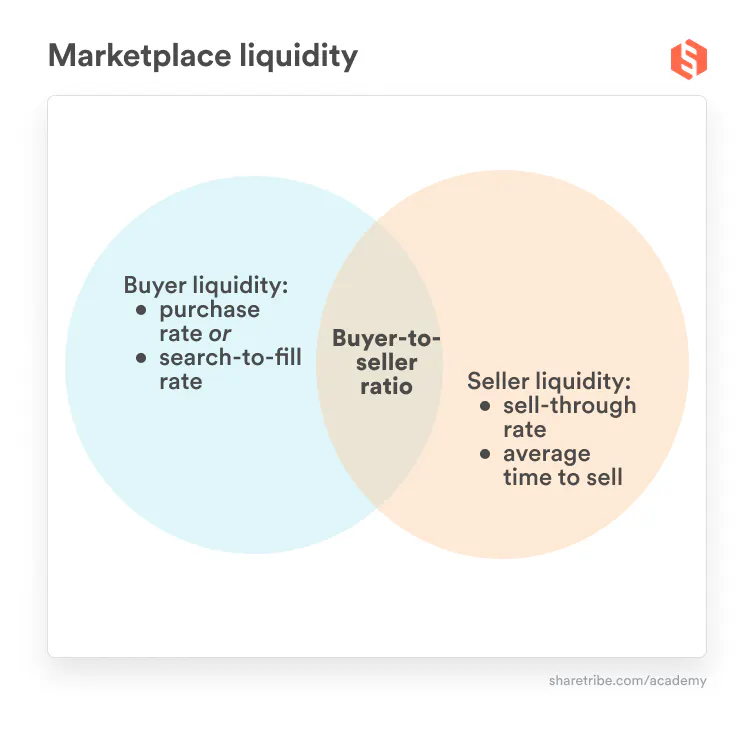
The image below places buyer purchase or search-to-fill measures beside seller sell-through and time-to-sell measures. The buyer-to-seller ratio sits between them because adding participants helps only if the mix improves the chance of a useful match.
To turn that activity into an economic assessment, read the selected sections of Sharetribe’s Marketplace metrics: 26 key metrics + how to use them. Treat its formulas as starting points: a marketplace’s own reporting definitions and accounting treatment take precedence.
Marketplace metrics: 26 key metrics + how to use them
Sharetribe sets out the acquisition, transaction, GMV, and take-rate measures needed to examine a two-sided business.
Under “Metrics to track your marketplace unit economics,” read from acquisition through contribution. Pay particular attention to the subsections “Customer acquisition cost (CAC),” “Seller acquisition cost,” and “Contribution Margin Per Transaction”; stop before “Customer lifetime value.” Then, under “Marketplace revenue metrics,” read “Gross Merchandise Value (GMV)” from GMV and its calculation. In the “Take Rate” and “Total Revenue and Net Revenue” subsections, read from fees through deductions. Note which amounts represent customer spending, platform revenue, and costs.
Suppose an illustrative marketplace processes an completed order and earns a 12% commission. Its commission revenue is , not the of merchandise value. If attributable payment, support, trust, and incentive costs total , contribution before acquisition costs is per order.
Now suppose acquiring a buyer costs . Five such orders produce only in transaction contribution, so they have not repaid buyer CAC. Suppose, additionally, acquiring a seller costs , and that seller is expected to complete 60 orders over the period being analyzed. Allocating that acquisition cost across those expected orders adds per order. Under these assumptions, contribution after the allocated seller acquisition cost is per order; a buyer would need about 12 orders to repay of buyer CAC. This allocation is an analytical choice, not a second fee charged on each transaction. It must be revised if seller productivity or retention differs from the assumption.
This is why a marketplace with rising gross merchandise value (GMV) can still have weak economics. GMV can rise through costly incentives, larger baskets, or new participants who never transact again. Examine completed orders, effective take rate, transaction-level contribution, repeat-buyer behavior, and seller productivity together. Sharetribe also uses “net revenue” for revenue after certain transaction-related deductions; that label is not automatically an accounting-standard revenue figure or a complete contribution-margin calculation. Specify exactly which deductions you have made, and check whether the marketplace recognizes the underlying sale as principal or acts as an agent.
4. Change the cost boundary for other archetypes
The same discipline applies beyond SaaS and marketplaces, but the binding cost changes.
For a payments provider, processed value is not retained revenue. Imagine million of payment volume on which the provider earns fees equal to 2.5%, or . If network, acquiring, and other payment costs consume , and attributable fraud and support consume another , illustrative contribution is . The relevant questions are fee yield and what remains after pass-through costs, losses, and service costs. Whether a company reports particular fees gross or net must be checked before comparing its published revenue yield with another provider’s.
For an advertising platform, eligible attention is not necessarily paid attention. A useful unit might be a thousand monetized impressions or a search session. Estimate advertising revenue after unfilled inventory, then deduct traffic-acquisition payments, creator or publisher shares where applicable, and attributable serving and safety costs. Better engagement need not improve unit economics if the additional attention commands a lower price or requires more expensive distribution.
For a cloud or AI-native service, model both the cost of a delivered workload and the utilization of capacity committed to delivering it. Suppose one million requests earn each. Attributable per-request compute, networking, storage, and support cost , while reserved capacity costs for the period. The period contributes after those costs. At half the volume, with the same price, variable cost, and reserved-capacity bill, contribution is only . This is an illustrative operating model, not a claim that capacity is always fixed: contracts, hardware ownership, and workload scheduling determine which costs can actually be adjusted. For an AI application, model or inference charges and any human review belong in the serving-cost estimate.
Hybrid companies need more than one unit. A commerce platform may earn commissions, advertising fees, and fulfillment revenue from related activity; a cloud company may combine subscriptions with consumption. Evaluate the economics of each stream, then identify shared costs and possible cross-subsidies before drawing a company-wide conclusion. A high-margin revenue stream can improve consolidated results without proving that every transaction or workload is attractive.
5. Turn the calculation into a defensible diagnosis
In a client or competitor analysis, a unit-economic number is most useful when its assumptions are visible. Record the unit and cohort, the period, the revenue recognized or estimated, the costs included, the acquisition spending attributed, and the evidence quality. Then vary the few assumptions most likely to reverse your conclusion: retention for SaaS; repeat purchase and seller throughput for a marketplace; fee yield and losses for payments; utilization and serving cost for compute.
Public disclosures often do not provide enough information to calculate customer-level CAC or contribution precisely. In that case, label the result a scenario or estimate, not a reported metric. Gross margin, sales-and-marketing expense, cohort disclosures, payment volume, and capacity commentary can constrain a plausible range, but they cannot make undisclosed cohort economics observable.
Conclusion
The right unit-economic test follows the business’s economic engine. SaaS links acquisition spending to retained gross profit; marketplaces link transaction contribution to buyer and seller acquisition and repeat activity; payments link fee yield to processing and risk costs; advertising links monetized attention to distribution and serving costs; and cloud or AI services link workload revenue to serving cost and capacity utilization. Always state the unit, cost boundary, and cohort before comparing results.
The next lesson moves from these economic engines to ecosystem control points: which assets a company controls, which complements make its offering more valuable, and where dependencies or bottlenecks could change its bargaining power.