Recommended resources
The freely available resources this lesson will direct you to.
Hello! Welcome to the first lesson in our second module, "Performance Profiling and Optimization."
In the previous module, we focused on tools for finding and fixing functional bugs. Now, we shift our attention to a different class of problems: performance bottlenecks. Based on our conversation, I know you're keen to get more comfortable with the Performance tab, and this is the perfect place to start.
Today's lesson introduces the Performance Monitor. Think of it as a real-time dashboard or a "check engine" light for your web application. It provides a live, high-level view of your site's health by tracking key metrics as you interact with it. This is often the first tool you'll reach for when investigating vague reports of "sluggishness," as it can help you quickly spot suspicious patterns before you commit to a full, in-depth performance recording.
By the end of this lesson, you will be able to use the Performance Monitor to track real-time metrics like CPU usage, JavaScript heap size, and DOM node count to get an initial diagnosis of your site's runtime performance.
Part 1: Introducing the Performance Monitor
The Performance Monitor is a panel within DevTools that displays a series of graphs showing key performance metrics in real-time. Unlike the main Performance panel, which requires you to record a session, the monitor is always "on," giving you immediate feedback.
Let's start with the official Chrome documentation to get a solid foundation on what the Performance Monitor is and the metrics it tracks.
This document from the Chrome Developers team provides a concise overview of the Performance Monitor panel, how to open it, and what it's used for.
Please read the 'Overview' and 'Open the Performance monitor panel' sections. As you read, take note of the specific metrics that the tool can display, such as CPU usage, JS heap size, and DOM Nodes.
As you saw in the documentation, the Performance Monitor gives you a dashboard with several key graphs. You can toggle each metric on or off depending on what you're investigating.
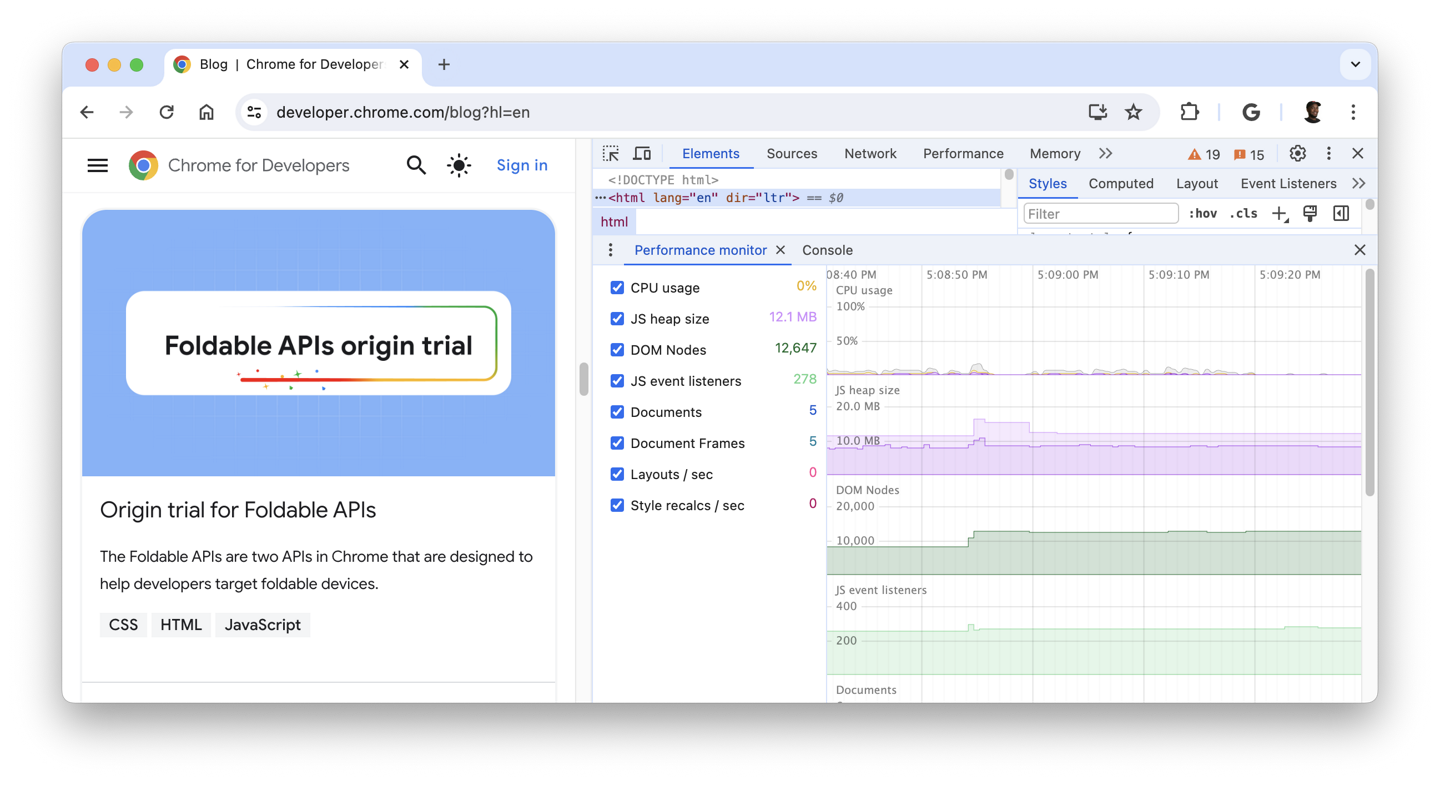
The most commonly used metrics are:
- CPU usage: Shows how much processing power the page is consuming. A sustained high usage or sudden spikes can indicate inefficient JavaScript.
- JS heap size: Tracks the amount of memory being used by JavaScript objects. A constantly increasing graph can be a sign of a memory leak.
- DOM Nodes: Counts the total number of DOM elements on the page. A rapid increase can signal problems with components being added but not removed.
- Layouts / sec & Style recalcs / sec: These show how often the browser has to recalculate the position and styling of elements. High numbers here, especially during animations or scrolling, can lead to jank (stuttering or choppiness).
Part 2: Using the Monitor for Diagnosis
The true power of the Performance Monitor comes from observing how these metrics change while you interact with your application. The workflow is simple: open the monitor, perform some actions on your page (e.g., scroll, click buttons, navigate between views), and watch the graphs for telling patterns.
Let's turn back to the documentation to see how this diagnostic process works in practice.
This section of the documentation explains how to interpret the changes in the graphs to identify potential performance issues.
Now, read the 'Use the Performance monitor panel' section. Focus on the examples given, such as watching 'DOM Nodes' and 'Layout/sec' while scrolling to spot layout thrashing, or identifying a spike in 'CPU usage' as a pointer to inefficient code.
To build on this, let's consider a practical blog post from a developer who used this exact tool to solve a real-world problem. This provides an excellent example of the monitor's role in a typical debugging workflow.
The Dev Tools Performance Monitor Panel
This short blog post by developer Dave Rupert demonstrates how the Performance Monitor immediately highlighted a problem with an animated component.
Read the entire post. Notice how the author used the 'Style recalculations per second' and 'CPU usage' graphs to quickly identify an issue, which then led to a deeper investigation with other tools.
As the post highlights, a key insight for a senior developer is recognizing patterns that suggest memory leaks in single-page applications (SPAs). If you navigate from one view to another and see the DOM Nodes and JS event listeners counts steadily climb without ever decreasing, it's a strong indication that old components and their associated listeners are not being properly garbage-collected. The Performance Monitor makes this pattern immediately visible.
Test your understanding!
You are investigating user reports that your SPA becomes slower over time, especially after visiting several different pages within the app. You suspect a memory leak related to component cleanup.
Describe the steps you would take using the Performance Monitor to confirm this suspicion. Which metrics would you focus on, and what pattern would you expect to see if your hypothesis is correct?
Show answer
- Open DevTools and then open the Performance Monitor (e.g., via the Command Menu:
Cmd+Shift+Pand typing "Show Performance monitor"). - Ensure that the DOM Nodes and JS event listeners metrics are checked and visible. You would also want to monitor JS heap size.
- Establish a baseline: Note the values for these metrics when the application first loads.
- Simulate user behavior: Navigate through several different pages or views within the SPA, pausing on each for a moment.
- Observe the graphs: If there is a memory leak, you would expect to see the graphs for DOM Nodes, JS event listeners, and JS heap size continuously trend upwards with each navigation. Critically, when you navigate away from a view, these numbers would not return to their previous levels, indicating that resources from the old view were not released. This "sawtooth" pattern that only goes up is a classic sign of a leak in an SPA.
Conclusion
In this lesson, we introduced the Performance Monitor as your first line of defense in performance analysis. It’s a lightweight but powerful tool for getting a real-time, high-level overview of your application's health.
Key Takeaways:
- The Performance Monitor provides real-time graphs of key metrics like CPU usage, memory (JS heap size), and DOM complexity.
- It is most effective when used to observe trends and patterns while you interact with your application.
- It excels at spotting symptoms of common performance issues, such as memory leaks in SPAs (constantly increasing DOM nodes/listeners) or excessive rendering work (high layouts/recalculations).
- Think of it as a diagnostic tool that tells you that a problem might exist and when it occurs, which helps you decide if a deeper analysis is needed.
Now that we know how to use the Performance Monitor to spot the symptoms of a performance problem, our next step is to learn how to perform a deep-dive analysis to find the cause. In our next lesson, we will use the main Performance panel to record a detailed profile and learn to interpret its flame chart, allowing us to pinpoint the exact JavaScript functions responsible for bottlenecks.