Recommended resources
The freely available resources this lesson will direct you to.
Hello! Welcome back to our course on mastering Chrome DevTools.
In our previous lesson, we focused on using the Performance panel's flame chart to hunt down slow JavaScript functions. We learned to identify long-running code by analyzing the widest blocks in the chart and leveraging the Bottom-Up tab to quantify Self Time and Total Time.
Today, we'll broaden our analysis of the Main thread. A task on the main thread isn't just JavaScript; it also involves the browser's rendering work. This lesson will teach you how to identify two critical types of bottlenecks: long tasks in their entirety and a particularly problematic pattern called forced synchronous layouts, or "layout thrashing." As a lead developer, mastering the diagnosis of these issues is fundamental to ensuring your applications are fluid and responsive.
A Deeper Look at the Main Thread and Long Tasks
As we touched on previously, a long task is any single piece of work on the main thread that takes longer than 50 milliseconds. When the main thread is occupied for this long, it can't respond to user input or render visual updates, which users perceive as lag, jank, or a frozen page.
While heavy JavaScript is a common cause, a task also includes other browser work like style calculations and layout. DevTools visually flags these long tasks to help you spot them immediately.
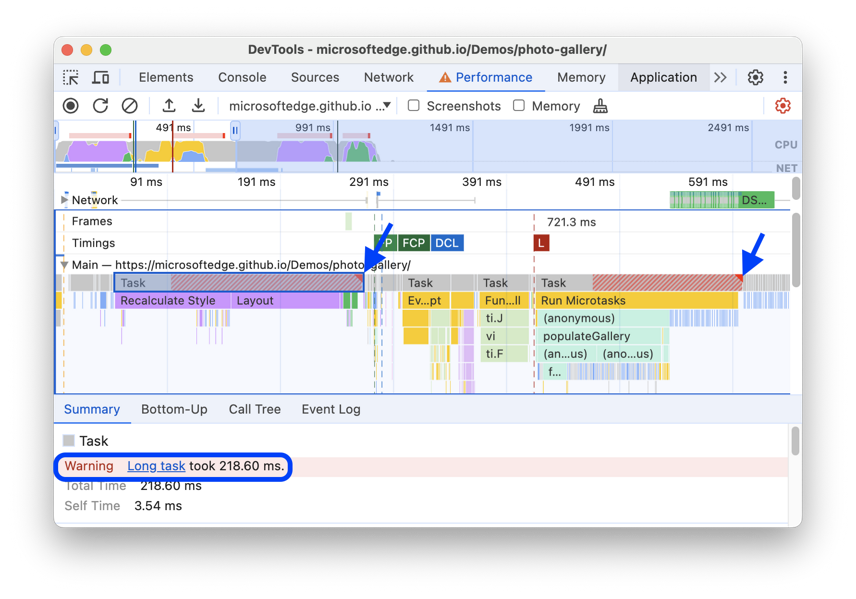
To understand how DevTools presents these tasks, let's refer to the official documentation.
Performance features reference
The official Chrome DevTools documentation explains how the flame chart represents main thread activity. We'll focus on the section that details how long tasks are visualized.
Please read the subsection titled 'Read the flame chart'. Pay close attention to the paragraph and image describing how long tasks are highlighted with a red triangle and red shading for the portion over 50ms.
This automatic highlighting serves as your first clue. When you see a red-flagged task, your next step is to investigate what made it so long.
Understanding Forced Synchronous Layouts
One of the most common and severe performance bottlenecks is the forced synchronous layout. To understand why it's so bad, we first need to appreciate the browser's normal, efficient rendering process. For each frame, the browser typically performs a sequence of operations:
- JavaScript: Run code that might change the DOM.
- Style: Calculate the styles for each element.
- Layout: Calculate the geometry and position of each element on the page (also known as "reflow").
- Paint: Fill in the pixels for each element onto layers.
- Composite: Draw the layers to the screen.
This pipeline is efficient when it flows in one direction. A forced synchronous layout occurs when your JavaScript interrupts this flow. It happens when you:
- Write: Change the DOM (e.g., add a class, change a style).
- Read: Immediately ask for a geometric value that depends on the layout (e.g.,
element.offsetHeight,element.clientWidth).
The browser has no choice but to stop, run the Style and Layout steps synchronously, and then return the value to your JavaScript so it can continue. If this write/read cycle happens repeatedly, for instance in a loop, it leads to layout thrashing, where the browser is forced to recalculate the layout over and over again, grinding performance to a halt.
The following article explains this concept clearly.
How To Fix Forced Reflows And Layout Thrashing
The DebugBear blog provides an excellent explanation of forced reflows and layout thrashing, complete with code examples.
Please read the first two main sections: 'What is a forced reflow while executing JavaScript?': This defines the problem and shows a simple code example. 'What is layout thrashing?': This explains the more severe, repetitive version of the problem. Focus on the relationship between writing a change and then reading a property that requires an up-to-date layout.
Identifying Layout Thrashing in the Performance Panel
Now that you understand the concept, let's see how to spot it in a performance trace. DevTools provides very clear warnings for this pattern.
You'll see a purple Layout or Recalculate Style event inside a yellow Function Call event. These forced layout events are marked with the same red triangle as long tasks, and hovering over them often reveals a warning: "Forced reflow is a likely performance bottleneck."
This next video demonstrates how to navigate the Main thread timeline and identify such a bottleneck.
Chrome DevTools for Performance Engineers - Performance
This video from QAInsights provides a practical walkthrough of a performance profile. We will focus on the part where the presenter identifies a forced reflow.
Watch from 05:15 to 06:15. The presenter expands the Main section and points out a task labeled 'Forced reflow.' Notice how they click on this task and the Summary tab at the bottom provides a link to the exact line of code in app.js that caused the issue.
As shown in the video, when you select the problematic Layout event, the Summary tab is your best friend. It gives you:
- The call stack that led to the layout calculation.
- A link to the line of code that triggered the read.
- Information on the Layout Invalidations, linking to the line of code that made the write, forcing the browser to recalculate.
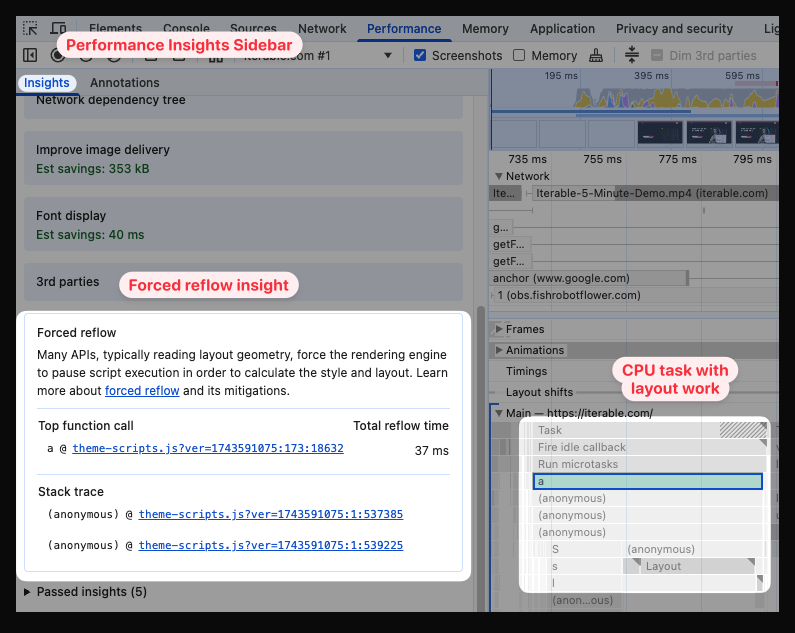
The Performance Insights sidebar in DevTools explicitly calls out a 'Forced reflow' and identifies the function call responsible. The main timeline shows the corresponding purple Layout task within a JavaScript task.
Fixing Layout Thrashing
The fundamental solution to layout thrashing is to decouple reads from writes. Instead of interleaving them, structure your code to first read all the necessary values from the DOM, and then perform all the writes.
Let's look at the article from DebugBear again for practical solutions.
How To Fix Forced Reflows And Layout Thrashing
This part of the article details how to use DevTools to trace the cause and outlines strategies for fixing the problem.
Please read the section 'How to fix forced synchronous layout work'. Focus on the strategies discussed, especially the principle of batching reads and writes as described in 'Fix layout thrashing by aggregating reading layout metrics'.
The primary strategy is to refactor your code. For example, instead of this:
// BAD: Causes layout thrashing
function sizeElements(elements) {
  for (let i = 0; i < elements.length; i++) {
    // Write
    elements[i].style.width = '50%';

    // Read (forces synchronous layout)
    let newWidth = elements[i].offsetWidth;
    console.log(`Element ${i} new width: ${newWidth}px`);
  }
}
You should refactor to batch the operations:
// GOOD: Avoids layout thrashing
function sizeElements(elements) {
  // Perform all writes
  for (let i = 0; i < elements.length; i++) {
    elements[i].style.width = '50%';
  }

  // Perform all reads
  for (let i = 0; i < elements.length; i++) {
    let newWidth = elements[i].offsetWidth;
    console.log(`Element ${i} new width: ${newWidth}px`);
  }
}
Deferring Non-Essential Work
Another powerful technique, especially for improving responsiveness during user interactions, is to defer non-essential work. If an analytical event or a secondary UI update is part of a long task, you can use setTimeout with a delay of 0 to yield to the main thread, allowing the browser to process critical rendering updates first.
This next video demonstrates identifying a long interaction, getting a suggestion to use setTimeout, applying the fix, and verifying the improvement.
Performance debugging in DevTools
This excellent video from the Chrome for Developers team shows a complete workflow: diagnosing a long interaction, using DevTools insights to get a fix, and verifying the result.
Watch from 07:30 to 10:18. Observe how a long processing duration is identified. The presenter then asks the experimental AI for a fix, which suggests using setTimeout to yield to the main thread. Finally, they apply this fix and record a new trace to prove that the Interaction to Next Paint (INP) was significantly improved.
Test your understanding!
You are tasked with optimizing the following function, which styles a list of boxes to have the same height as the tallest box in the list. This code is causing noticeable jank.
function equalizeBoxHeights(boxes) {
  let maxHeight = 0;

  // Find the max height
  boxes.forEach(box => {
    if (box.offsetHeight > maxHeight) {
      maxHeight = box.offsetHeight;
    }
  });

  // Apply the max height to all boxes
  boxes.forEach(box => {
    box.style.height = `${maxHeight}px`;
  });
}
At first glance, this seems to follow the "read then write" pattern. However, a colleague points out that the initial offsetHeight reads could be inaccurate if previous JavaScript has invalidated the layout.
How would you rewrite this function to be more robust and performant by ensuring all layout calculations are done in a single, batched step, separating reads from writes definitively?
Show answer
The best approach is to use a library like FastDOM or a manual two-phase approach to strictly separate reads and writes, often using requestAnimationFrame for scheduling. However, a simple and effective refactor without external libraries is to ensure all reads are done before any writes.
The original code already does this correctly! It first loops to read all offsetHeight values and then loops again to write the style.height. This is a good pattern.
The trick in the question was to test if you'd change a correct implementation. The problem described ("previous JavaScript has invalidated the layout") is external to this function. To make equalizeBoxHeights itself robust, you could schedule it within a requestAnimationFrame call to ensure it runs after the browser has completed the layout for the current frame.
A slightly more defensive version inside an animation frame would look like this:
function equalizeBoxHeights(boxes) {
  // Schedule the work for the next animation frame
  requestAnimationFrame(() => {
    // 1. READ PHASE
    const heights = [];
    boxes.forEach(box => {
      heights.push(box.offsetHeight);
    });

    const maxHeight = Math.max(...heights);

    // 2. WRITE PHASE
    boxes.forEach(box => {
      box.style.height = `${maxHeight}px`;
    });
  });
}
This ensures that when the reads occur, the layout is stable from the previous frame, giving you accurate measurements before you apply the new styles. The core principle of separating reads and writes remains the same.
Conclusion
In this lesson, we moved beyond just looking for slow JavaScript and learned to analyze the entire main thread task. We saw how to identify and diagnose long tasks and, most importantly, the pernicious pattern of forced synchronous layouts and layout thrashing.
Key Takeaways:
- Long Tasks (>50ms) block the main thread and are flagged by DevTools with a red triangle. They can include JS, style, and layout work.
- Forced Synchronous Layouts occur when your JS code writes a DOM change and then immediately reads a geometric property, forcing the browser to recalculate layout mid-task.
- Layout Thrashing is the repeated execution of this write/read cycle, causing severe performance degradation.
- You can identify forced layouts by finding purple Layout events inside yellow Function Call blocks in the flame chart. The Summary tab will reveal the initiator and cause.
- The primary solution is to refactor your code to batch DOM reads and writes separately.
In our next lesson, we will continue our journey through the rendering pipeline. We'll shift our focus from JS and layout to the final stages: painting and compositing. You'll learn to use tools like the FPS meter, Paint Flashing, and Layer Borders to diagnose jank and excessive repaints.