Recommended resources
The freely available resources this lesson will direct you to.
Hello! Welcome to the sixth lesson in our module on the chemical engineering fundamentals of metallurgy.
In our last lesson, we connected the abstract concept of Gibbs free energy () to a tangible process variable: the equilibrium oxygen partial pressure (). We saw that for reactive metals like titanium, the equilibrium is incredibly low, quantifying why their reduction is so difficult. While calculating this for a single reaction is useful, comparing multiple potential reducing agents across a range of temperatures would be laborious.
Today, we introduce an elegant graphical tool that solves this problem: the Ellingham diagram. This lesson will teach you how to read and interpret these diagrams, which are central to the field of extractive metallurgy. By the end, you will be able to use an Ellingham diagram to quickly compare the stability of different metal oxides and select an appropriate reducing agent based on thermodynamic principles.
1. The Anatomy of an Ellingham Diagram
At its core, an Ellingham diagram is a plot of the standard Gibbs free energy of formation () for oxidation reactions against temperature (). It's based on the familiar Gibbs free energy equation:
Given your mathematical background, you'll immediately recognize this as the equation of a straight line, , where:
- (Temperature)
- (The y-intercept, as is the value of at K)
- (The slope)
Since the formation of a metal oxide from a metal and oxygen is almost always exothermic, is negative. The diagram plots on the y-axis, with more negative values (indicating greater stability) towards the bottom.
The following video provides an excellent, detailed walkthrough of these foundational principles. It explains how the equation relates to the lines on the graph and, most importantly, why the lines have the slopes they do.
Ellingham Diagram in Metallurgy || Super-Tricks and Core Concept || IIT Jee Mains | Advanced | NEET
This video from IITian explains provides a clear walkthrough of the principles behind the Ellingham diagram. We'll start with the foundational concepts.
Please watch from the introduction of the diagram (02:06) to the explanation of the slopes (20:05). Focus on understanding: The relationship between the Gibbs free energy equation (ΔG = ΔH - TΔS) and the straight lines on the graph (y = c + mx). Why most lines have a positive slope (due to a decrease in entropy, ΔS° < 0, when a gas is consumed). Why the line for carbon's oxidation to CO (2C + O₂ -> 2CO) uniquely has a negative slope (due to an increase in entropy, ΔS° > 0).
2. Using the Diagram: Stability and Reduction
The power of the Ellingham diagram lies in its ability to compare multiple reactions at once. The key principles are:
- Stability: The lower a reaction's line on the diagram at a given temperature, the more negative its . This means the resulting oxide is more stable.
- Reduction: A metal 'A' can reduce the oxide of another metal 'B' if the line for the formation of A's oxide is below the line for the formation of B's oxide at that temperature.
Why does this work? Consider the reduction of a metal oxide, MO, by a reducing agent, R:
This is a coupled reaction. We can think of it as the sum of two separate reactions:
- Decomposition of MO:
- Formation of RO:
The overall Gibbs free energy change is . For the reduction to be spontaneous, must be negative. This requires that is more negative than — which on the diagram, means the line for RO must be below the line for MO.
The following reading explains this core principle concisely and gives a critical example directly relevant to our course.
Now for the central application of the diagram. This reading from an MIT course concisely explains how to use the relative positions of the lines to choose a reducing agent.
Read the section 'Ease of Reduction'. Pay close attention to the core principle: 'A given metal can reduce the oxides of all other metals whose lines lie above theirs on the diagram.' Note the specific example given for titanium!
Now let's see this principle applied with a few more examples.
Ellingham Diagram in Metallurgy || Super-Tricks and Core Concept || IIT Jee Mains | Advanced | NEET
The next segment of the video demonstrates how to compare two reactions and determine which metal will act as the reducing agent.
Watch the section on 'Selection of Reducing Agents' from 35:51 to 42:45. Notice how the logic consistently comes back to which oxide is more stable (i.e., has a more negative ΔG°).
3. Interpreting the Diagram: A Practical Example
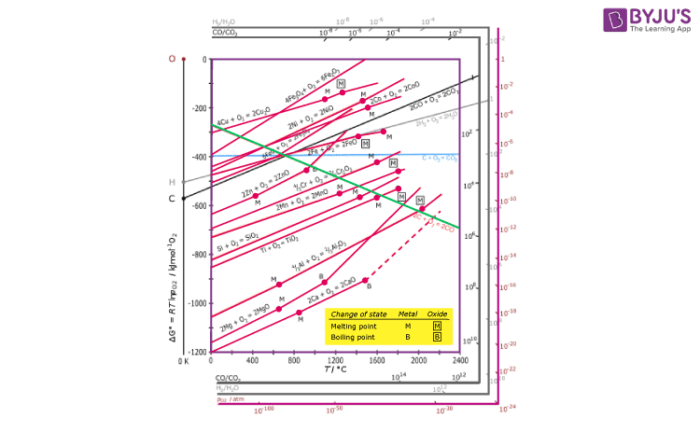
Let's put this into practice. Below is a standard Ellingham diagram for various metal oxides.
Test your understanding!
Using the Ellingham diagram above, answer the following questions:
- At 1000 °C, can aluminum (Al) be used to reduce chromium(III) oxide (Cr₂O₃) to metallic chromium?
- At 600 °C, is zinc oxide (ZnO) or magnesium oxide (MgO) more stable?
- Based on your answer to #2, what would happen if you heated a mixture of zinc metal and magnesium oxide to 600 °C?
Show answer
-
Yes. At 1000 °C, the line for the formation of Al₂O₃ is significantly below the line for Cr₂O₃. This means for Al₂O₃ formation is much more negative, so aluminum has a stronger affinity for oxygen than chromium does. Aluminum will therefore "take" the oxygen from the chromium oxide, reducing it to metallic chromium. This is the basis of the thermite reaction.
-
At 600 °C, the line for MgO is far below the line for ZnO. Therefore, MgO is much more stable than ZnO.
-
Nothing would happen. Since MgO is the more stable oxide, magnesium has a much higher affinity for oxygen than zinc. There is no thermodynamic driving force for the zinc to take oxygen away from the highly stable magnesium oxide. The reaction has a positive and is not spontaneous.
4. The Special Role of Carbon
As you saw in the first video, carbon is a special case because of its different oxidation reactions:
- : One mole of gas produces one mole of gas, so entropy change () is near zero. The line is almost horizontal.
- : One mole of gas produces two moles of gas, so entropy increases significantly (). The slope () is therefore negative.
This downward-sloping line for CO formation is the key to carbon's widespread use as a reducing agent in pyrometallurgy. As temperature increases, this line crosses below the lines of many metal oxides (like ZnO, FeO, Cr₂O₃). The temperature at which the lines cross is called the crossover temperature. Above this temperature, carbon becomes a thermodynamically viable reducing agent for that oxide.
The following video segment provides a deep dive into the thermodynamics of carbon's different oxidation reactions and explains the significance of the crossover temperature at which carbon becomes a better reducing agent than carbon monoxide.
Ellingham Diagram in Metallurgy || Super-Tricks and Core Concept || IIT Jee Mains | Advanced | NEET
The use of carbon as a reductant is fundamental to industrial metallurgy. This final segment of the video explains in detail the behavior of the three carbon oxidation lines and how to interpret them.
Watch from 50:00 to 58:45. This part is conceptually dense but very important. Focus on: The thermodynamic reasons for the different slopes of the C→CO₂, C→CO, and CO→CO₂ lines. The significance of the crossover temperature around 700 °C (973 K), where carbon (C) becomes a more effective reductant than carbon monoxide (CO). The practical trade-offs of using carbon at very high temperatures.
5. Application to Titanium
Let's bring this back to our main goal: understanding titanium production. Locate the line for Ti + O₂ → TiO₂ on the Ellingham diagram. You'll notice it's very low on the chart, confirming what we calculated in the last lesson: TiO₂ is an exceptionally stable oxide.
To reduce TiO₂, we need a reducing agent whose oxide formation line is even lower.
- Carbon: Find the line for
2C + O₂ → 2CO. It crosses the TiO₂ line at a very high temperature, around 1700 °C. While thermodynamically possible, attempting this carbothermic reduction at such high temperatures leads to the formation of titanium carbide (TiC), an impurity that makes the metal brittle and useless for most applications. - Magnesium: Now find the line for
2Mg + O₂ → 2MgO. It is well below the TiO₂ line across a wide range of practical temperatures (e.g., 800-1000 °C).
This direct comparison on the Ellingham diagram provides the fundamental thermodynamic justification for the Kroll process. Carbon is problematic, but magnesium is a potent enough reducing agent to successfully reduce titanium compounds to metal. We will see this principle applied to titanium tetrachloride (TiCl₄) later in the course.
Conclusion
You can now interpret Ellingham diagrams, a cornerstone of metallurgical thermodynamics.
- Key Takeaways:
- Ellingham diagrams plot vs. , with lower lines indicating more stable oxides.
- A metal can reduce any oxide whose formation line lies above its own on the diagram.
- The unique downward-sloping line for CO formation explains why carbon is such a versatile high-temperature reducing agent.
- For TiO₂, the diagram clearly shows that while carbothermic reduction is possible at extreme temperatures, it's problematic. It also shows that magnesium is a thermodynamically powerful choice for reduction.
In the last few lessons, we've focused on the feasibility of reactions using Gibbs free energy. However, feasibility doesn't tell us about the heat requirements. Most metallurgical processes run at high temperatures and involve significant energy transfer.
In our next and final lesson of this module, we will return to the first law of thermodynamics. We will combine our knowledge of enthalpy () with the energy balance equation to determine how much heat we need to supply to (or remove from) a reactor to make these high-temperature processes work in practice.