Recommended resources
The freely available resources this lesson will direct you to.
Hello! This course follows the dimensional-modeling design life cycle in the requested Redbook: it begins with business questions, then develops fact tables, dimensions, historical behavior, and finally a PostgreSQL implementation and design review. In this first module, the aim is to make design decisions before choosing tables.
Today you will translate analytical questions into three things: a business process to model, candidate measures to calculate, and candidate dimensions that provide context. Your SQL and data-engineering experience will be useful, but the first decision is semantic rather than technical: what activity is the business asking you to analyze?
Begin with the activity, not the source tables
Suppose a stakeholder asks, “How much revenue did we invoice last quarter, broken down by product category and shipping region?” You could begin by inspecting an orders schema. But a table named orders does not settle whether “revenue” means an order placed, goods shipped, or an invoice issued. Those are different business activities, potentially recorded at different times and in different amounts.
A business process is a repeatable activity that generates events or observations worth analyzing: invoicing sales, shipping orders, receiving stock, or taking an inventory snapshot. For this question, sales invoicing is a plausible process. “Product category” and “shipping region” describe the invoiced sales; they are not separate processes merely because they appear in separate source tables.
Watch the opening of Data Modeling Tutorial: Star Schema (aka Kimball Approach) from Kahan Data Solutions. It places the fact-and-dimension design between source systems and analytical use, then explains why the business activity matters more than an indiscriminate copy of source tables.
Data Modeling Tutorial: Star Schema (aka Kimball Approach)
Watch the opening of Kahan Data Solutions’ “Data Modeling Tutorial: Star Schema (aka Kimball Approach)” for a compact visual introduction to choosing an activity and describing it.
Watch the architecture for the relationship between sources, facts, dimensions, and reports. Continue with the business activity; focus on how the choice of what to record affects future analysis. Then watch dimension context for the distinction between a measurement and an attribute used to describe it. You can skip the intervening table-creation walkthrough for this lesson.
The video favors the finest available detail. That is a useful design instinct, provided the detail belongs to the chosen activity and is supported by the sources. An order transaction is not automatically a better record of invoiced revenue than an invoice event. First establish which activity answers the question; the next lesson will make the record-level definition precise.
Parse a question into a measurement and its context
An analytical question often contains a measurable result, a way to divide that result, and a time reference. Consider:
“How many units were invoiced by product category and customer segment each month?”
“Units invoiced” is the candidate measure: a quantity you may be able to sum. Product category, customer segment, and month are the candidate dimensional context: values used to filter or group the measurement. “Category” is likely an attribute of a product dimension; it does not automatically require a category dimension of its own. Likewise, month may be an attribute of a date dimension rather than a separate month table.
The word candidate matters. A business question tells you what an analyst needs, not whether each value exists in the source data, is available at the right level of detail, or has an agreed definition. For example, “customer segment” might mean a segment assigned when the invoice was issued or the customer’s segment today. Both are intelligible requests; they can produce different historical reports.
The dbt tutorial Building a Kimball dimensional model with dbt provides a useful worked sales example. Read only its business-process identification and initial fact/dimension discussion; its project setup and implementation come later in this course.
Building a Kimball dimensional model with dbt
Read “Building a Kimball dimensional model with dbt” from dbt Labs to see how a stakeholder’s revenue question becomes a sales-process design with candidate measurements and descriptive context.
In “Part 2: Identify the business process,” begin where the text says that identification is done with the business user. Read the stakeholder context, then continue through the product, customer, order-status, and shipping-location breakdowns at the start of “Part 3: Identify the fact and dimension tables.” In that part, read its “Fact tables” and “Dimension tables” subsections through the list of possible source tables ending “And many more.” Use the sales example to check which elements describe an event and which are quantities associated with it. Stop before the discussion of how to construct the dimension tables.
The tutorial identifies sales as the process, order quantity and revenue as measurements available from order details, and product, customer, status, shipping location, and date as analytical context. Notice that finding a source table for a dimension is a feasibility check, not the definition of the business process.
Keep related questions together—and different processes apart
Imagine receiving the following requests for one reporting initiative. A requirements ledger makes their relationship clearer than a list of requested tables:
| Analytical question | Likely process | Candidate measure | Candidate dimensions or attributes |
|---|---|---|---|
| What invoiced revenue did each product category generate by month? | Sales invoicing | Invoiced revenue | Product category; invoice month |
| How many units were invoiced by customer segment and shipping region? | Sales invoicing | Units invoiced | Customer segment; shipping region |
| What was the realized price per unit by customer segment last quarter? | Sales invoicing | Invoiced revenue and units; price derived from them | Customer segment; invoice quarter |
| How many shipments arrived more than five days after ordering, by carrier? | Order fulfillment | Late-shipment count; elapsed days | Carrier; order date; delivery date |
| How many units were on hand at each month-end, by product category? | Inventory position | Month-end units on hand | Snapshot month; product category |
The first three questions plausibly belong to one invoicing process. They ask for different views or calculations over the same kind of activity. The fourth asks about fulfillment; an order might have multiple shipments, so an invoicing record alone may not represent the required observations. The fifth asks for a state at a point in time, not a sale. Do not merge these activities into one proposed fact table simply because they all mention products and dates. Later lessons will determine their exact grains and fact-table patterns.
A derived result is also worth distinguishing from a stored observation. If one invoice line records revenue of 80 for two units and another records revenue of 20 for one unit, the combined realized price is per unit—not the unweighted average of the two line prices, 30. At this stage, record “realized price per unit” as an analytical requirement, with revenue and quantity as candidate inputs. You will formalize aggregation rules in a later lesson.
Now compare those questions with the supplied sales star-schema image:
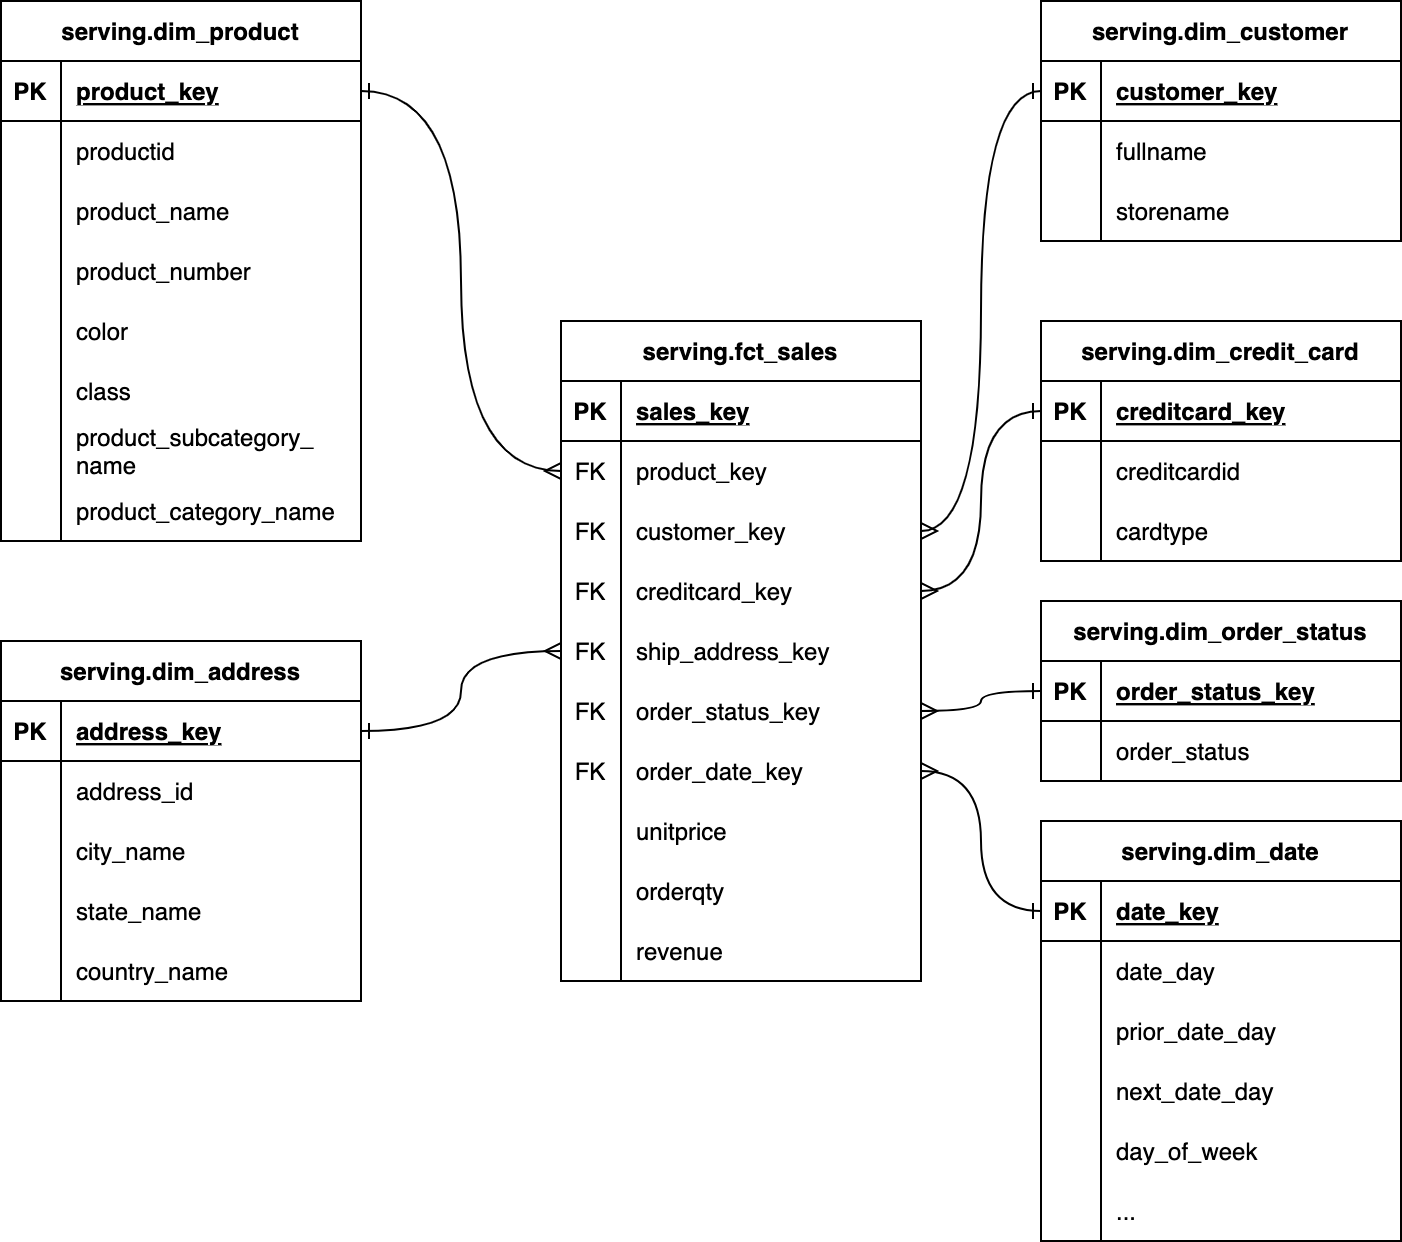
The picture helps you see why one process can support many breakdowns. The product dimension contains category and subcategory names; the address dimension contains geographical attributes. They provide different views of sales without changing the central question of what was sold. The diagram’s sales_key identifies a stored row, but a row identifier alone does not tell you what business event that row represents. You still need to confirm that meaning with the source data and stakeholders.
Turn the initial mapping into a usable requirement
Before committing the candidate list to a design, make ambiguities visible. For “invoiced revenue by product category and month,” a short definition might read:
Process: issuing sales invoices. Measure candidate: invoiced revenue, with an agreed treatment of discounts, tax, and credit notes. Context candidates: product category as recorded for the invoiced product, and invoice month. Source check: confirm that invoice details identify products and carry—or permit calculation of—the required amount.
This is more useful than “join invoice, product, and date.” It gives a stakeholder something to verify and gives you a concrete source-to-target investigation. Questions worth recording alongside it include:
- Does “revenue” mean gross invoiced amount or an amount net of discounts and returns?
- Does “month” mean order, shipment, or invoice month?
- Does a reported status mean its value at invoicing time or its current value?
- Are category, segment, and shipping region available for every relevant invoice, including historical ones?
You need not resolve every modeling technique now. The deliverable for this lesson is a traceable requirements map: each question has a named activity, a proposed measurement or calculation, descriptive breakdowns, a time interpretation, and any unresolved source or business-definition assumptions. A metric becomes trustworthy when those assumptions are explicit enough to verify.
Conclusion
Business questions should determine the model’s scope, not merely decorate a schema chosen from available tables. Name the activity being analyzed; separate quantities from the attributes used to examine them; and keep questions about sales, fulfillment, and inventory distinct when they describe different observations. Treat all three outputs as candidates until business definitions and source data agree.
Next, you will make the most consequential refinement to this map: declaring exactly what one row in a proposed fact table means and testing whether that grain is atomic.