Hello! Welcome to the first lesson in our module on UI & Rendering Performance Optimization.
In our previous module, you mastered Core Data, culminating in using NSFetchedResultsController for highly efficient data-driven UI. Now, we'll shift our focus from the data layer to the rendering layer, tackling another critical aspect of creating a professional, high-quality app: a silky-smooth user interface.
This lesson's goal is to equip you to profile rendering performance and identify dropped frames using the Core Animation instrument. You'll learn the theory behind UI smoothness, understand what a "dropped frame" or "hitch" is, and gain hands-on experience with the primary tool for diagnosing these issues.
What is Rendering Performance? The Quest for 60 FPS
A smooth user interface isn't magic; it's the result of your application consistently drawing new frames on the screen at a high frequency. For most iOS devices, this target is 60 frames per second (FPS), which gives your app a budget of just 16.67 milliseconds to do everything required to produce a single frame. On devices with ProMotion displays, the target is 120 FPS, cutting the budget in half to a mere 8.33 milliseconds.
When your app fails to meet this deadline, the system is forced to display the previous frame again. The user perceives this as a stutter or a "jump" in an animation or scroll. We call this a hitch or a dropped frame.
To understand this better, let's watch a short, excellent explanation of what a hitch is and how it impacts the user experience.
Eliminate animation hitches with XCTest - WWDC20 - Videos
This clip from a WWDC talk clearly defines what a hitch is, why it occurs, and introduces "hitch ratio"—a more precise metric than FPS for quantifying animation smoothness.
Watch from the beginning to 02:02. Pay close attention to the definition of a hitch and the recommended target hitch ratios. This terminology is key to discussing performance professionally.
As the video explains, a good user experience targets a hitch ratio under 5 ms/s. When you start seeing values above 10 ms/s, the hitches become very noticeable and detrimental to your app's perceived quality.
The Render Loop: Why Hitches Happen
To understand why hitches occur, we need a mental model of how the system renders your UI. This process is often called the Render Loop.
Essentially, for each frame, your app must:
- Handle Events: Process user input like touches and taps.
- Update UI & Layout: Run your application logic on the main thread. This includes calculating Auto Layout constraints, running view body updates in SwiftUI, etc.
- Commit Transaction: Package up the layer tree (a representation of your view hierarchy) and send it to a separate process called the Render Server.
- Render: The Render Server, using the GPU, composites the layers and renders the final frame to be displayed.
A hitch occurs when Step 2—the work on your app's main thread—takes too long and bleeds into the time reserved for rendering.
The following video provides a clear visualization of this process and the consequence of a delay.
WWDC25: Optimize SwiftUI performance with Instruments | Apple
This WWDC segment visually breaks down the render loop, showing a 'good' scenario versus one with a hitch. This will solidify your understanding of how a main thread delay causes a visible stutter.
Watch from 09:53 to 11:19. The key takeaway is seeing how a long UI update on the main thread causes a missed frame deadline, forcing the previous frame to remain on screen for an extra cycle.
Introducing Instruments and the Core Animation Tool
Now that you understand the "what" and "why," let's get to the "how." How do we find these performance bottlenecks? The answer is Instruments, Xcode's powerful suite of performance analysis tools.
You can launch Instruments directly from Xcode by navigating to Product → Profile (or pressing ⌘+I). This builds your app and presents a selection of templates, each designed for a specific type of analysis.
For rendering performance, we're interested in the Core Animation instrument, which is often found within the Animation Hitches template in modern versions of Xcode.

Once you start a recording, Instruments captures a wealth of data and displays it on a timeline. The Frames Per Second (FPS) graph is your first indicator of trouble. A healthy app should show a flat line at 60 FPS during animations or scrolling, whereas dips in this graph point directly to periods with dropped frames.
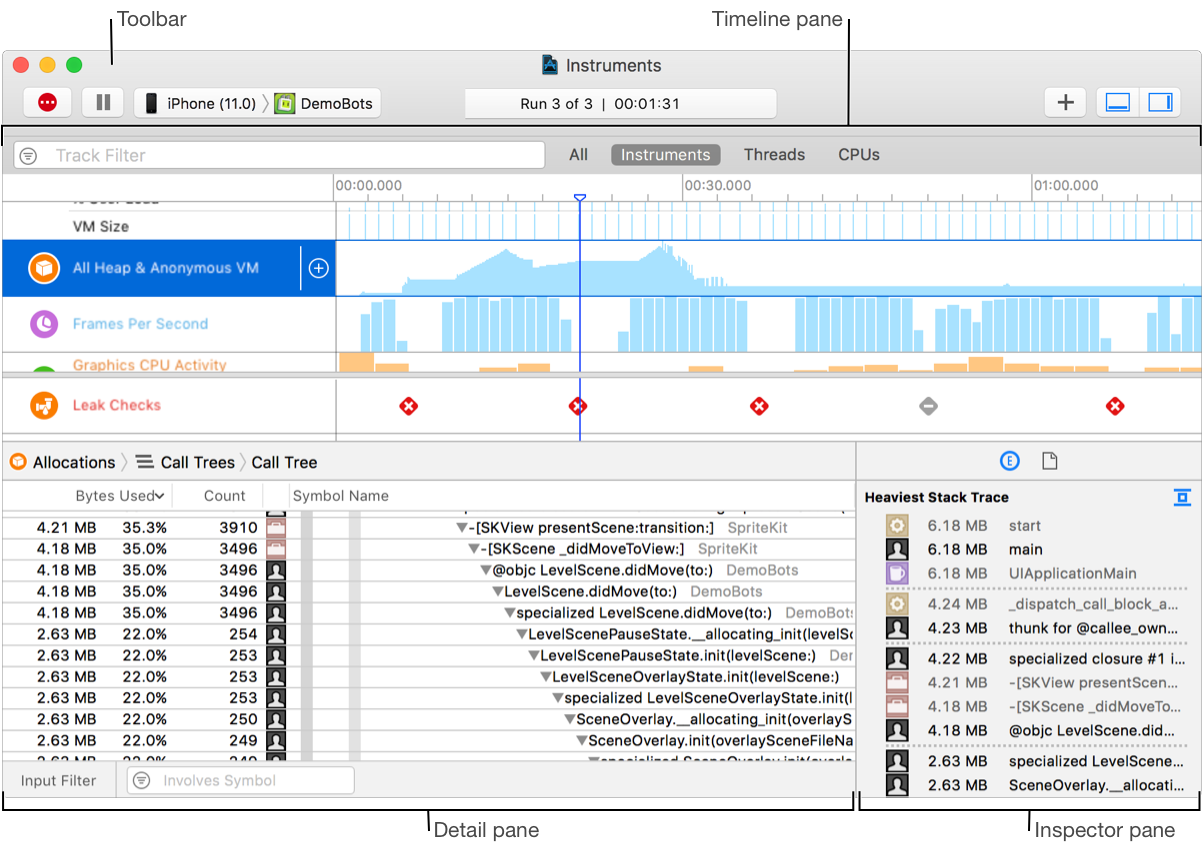
Finding Bottlenecks with Core Animation Debug Options
Seeing a dip in the FPS graph tells you when a problem occurred, but not what caused it. The Core Animation instrument provides powerful debugging overlays that you can enable to diagnose the root cause. These options color-code your running app in real-time to highlight expensive rendering operations.
The following article provides a concise and practical guide to these options.
Visualizing App Performance with the Core Animation Tool
This article provides a fantastic summary of the most important Core Animation debug options. We will use it as our guide for the practical part of this lesson.
Read the section titled "Visualizing App Performance with the Core Animation Tool." This will be your reference for the following analysis steps. Focus on understanding what 'Color Blended Layers' and 'Color Offscreen-Rendered' mean.
Let's walk through a typical diagnostic workflow using the key options from that article.
Step 1: Profile Your App and Identify a Slowdown
- Launch Instruments (⌘+I) and select the Animation Hitches template.
- Click the red "Record" button to start profiling.
- In your app, perform the action that feels slow or janky, such as scrolling a complex table view or triggering a custom transition.
- Stop the recording and examine the FPS track for dips that correspond to the slow action.
Step 2: Enable Core Animation Debug Overlays
While Instruments is attached to your app (either during recording or when paused), you can enable debug overlays. Go to Debug → View Debugging → Rendering in Xcode's menu bar (or find a similar menu in Instruments itself, which can vary by version).
Step 3: Analyze the Common Culprits
Now, look for these two major performance killers in your app's UI.
1. Color Blended Layers (The Red Flag)
- What it is: When multiple translucent UI elements are stacked, the GPU has to do extra work to compute the final color of each pixel by blending the layers.
- What it looks like: Instruments highlights these areas with a red overlay. The more intense the red, the more layers are being blended.
- Common Causes:
UILabelorUITextViewwith a transparent background placed on top of other views.- Custom views that use
alphaor transparency.
- The Fix: Whenever possible, make your views opaque. Set the
backgroundColorof labels and other views to a solid color instead of.clear. Ensure theisOpaqueproperty of your views istrueif they don't have any transparent content.
2. Color Offscreen-Rendered (The Yellow/Purple Flag)
- What it is: This occurs when the GPU must first render a portion of your view hierarchy into a separate, off-screen buffer, and then render that buffer back into the main screen. This "context switch" is very expensive.
- What it looks like: Instruments highlights these areas with a yellow overlay (or purple in some contexts).
- Common Causes:
- Applying shadows (
layer.shadowPath). - Using masks (
layer.mask). - Setting
layer.cornerRadiuson a view that also haslayer.masksToBounds = true. - Applying certain visual effects that require rasterization.
- Applying shadows (
- The Fix: This is more nuanced.
- For shadows, you can significantly improve performance by explicitly setting the
shadowPath. This gives Core Animation a pre-defined shape to draw instead of having to calculate it from the view's contents. - For rounded corners on images, it's often more performant to draw the rounded image once in a background graphics context and cache it, rather than clipping the
UIImageViewon every frame. We'll cover some of these specific techniques in later lessons.
- For shadows, you can significantly improve performance by explicitly setting the
By methodically enabling these flags and inspecting your UI, you can quickly identify which rendering operations are contributing to your dropped frames and begin to address them.
Conclusion
You now have a solid foundation for diagnosing and understanding UI rendering performance. This is a fundamental skill for any professional iOS developer, as a smooth and responsive UI is a hallmark of a high-quality application.
Key Takeaways:
- Your app has a strict time budget (e.g., 16.67ms at 60 FPS) to prepare and render each frame.
- Missing this deadline causes a hitch, a user-perceptible stutter in animations and scrolling.
- The Core Animation instrument is the primary tool for diagnosing these issues.
- Look for dips in the FPS graph to identify when hitches occur.
- Use debug overlays to find the root cause:
- Color Blended Layers (Red): Indicates expensive transparency blending. Fix by making views opaque.
- Color Offscreen-Rendered (Yellow): Indicates expensive off-screen rendering passes. Common with shadows and masks.
Preview of the Next Lesson:
While today we focused on GPU-bound issues like blending and off-screen rendering, much of the work in the render loop happens on the CPU, specifically on the main thread. In our next lesson, we will diagnose and fix layout performance issues caused by complex constraint hierarchies. You'll learn how Auto Layout can become a CPU bottleneck and how to use the Time Profiler to find and simplify slow layouts.