Hello! Welcome to the final lesson in our first module on the foundational principles of Raman scattering.
In our previous lesson, we distinguished between Rayleigh, Stokes, and anti-Stokes scattering. We learned that these processes arise from different energy transitions within the molecule and that anti-Stokes peaks are significantly weaker than their Stokes counterparts. We attributed this, qualitatively, to the smaller population of molecules in a vibrationally excited state at room temperature.
Today, we will quantify that relationship. You will use a concept from physical chemistry that is likely familiar to you—the Boltzmann distribution—to explain precisely why and by how much the anti-Stokes signal is weaker.
Your learning outcome for this lesson is to: Explain the intensity difference between Stokes and anti-Stokes bands using the Boltzmann distribution.
By the end of this lesson, you will be able to calculate the theoretical intensity ratio between a Stokes and anti-Stokes peak and understand how this relationship is exploited in the practical application of Raman thermometry.
1. From Population to Intensity: The Boltzmann Distribution
In the previous lesson, we established that the Stokes signal originates from molecules in the ground vibrational state (), while the anti-Stokes signal originates from molecules already in an excited vibrational state ().
At thermal equilibrium, the relative population of these two states is not equal. It is governed by the Boltzmann distribution. Given your background in physical chemistry, you'll recognize this as a fundamental principle of statistical mechanics. The ratio of the number of molecules in the first excited state () to the number of molecules in the ground state () is given by:
where:
- is the energy difference between the two states (). In our case, this is the energy of the vibrational mode, or .
- is the Boltzmann constant ().
- is the absolute temperature in Kelvin.
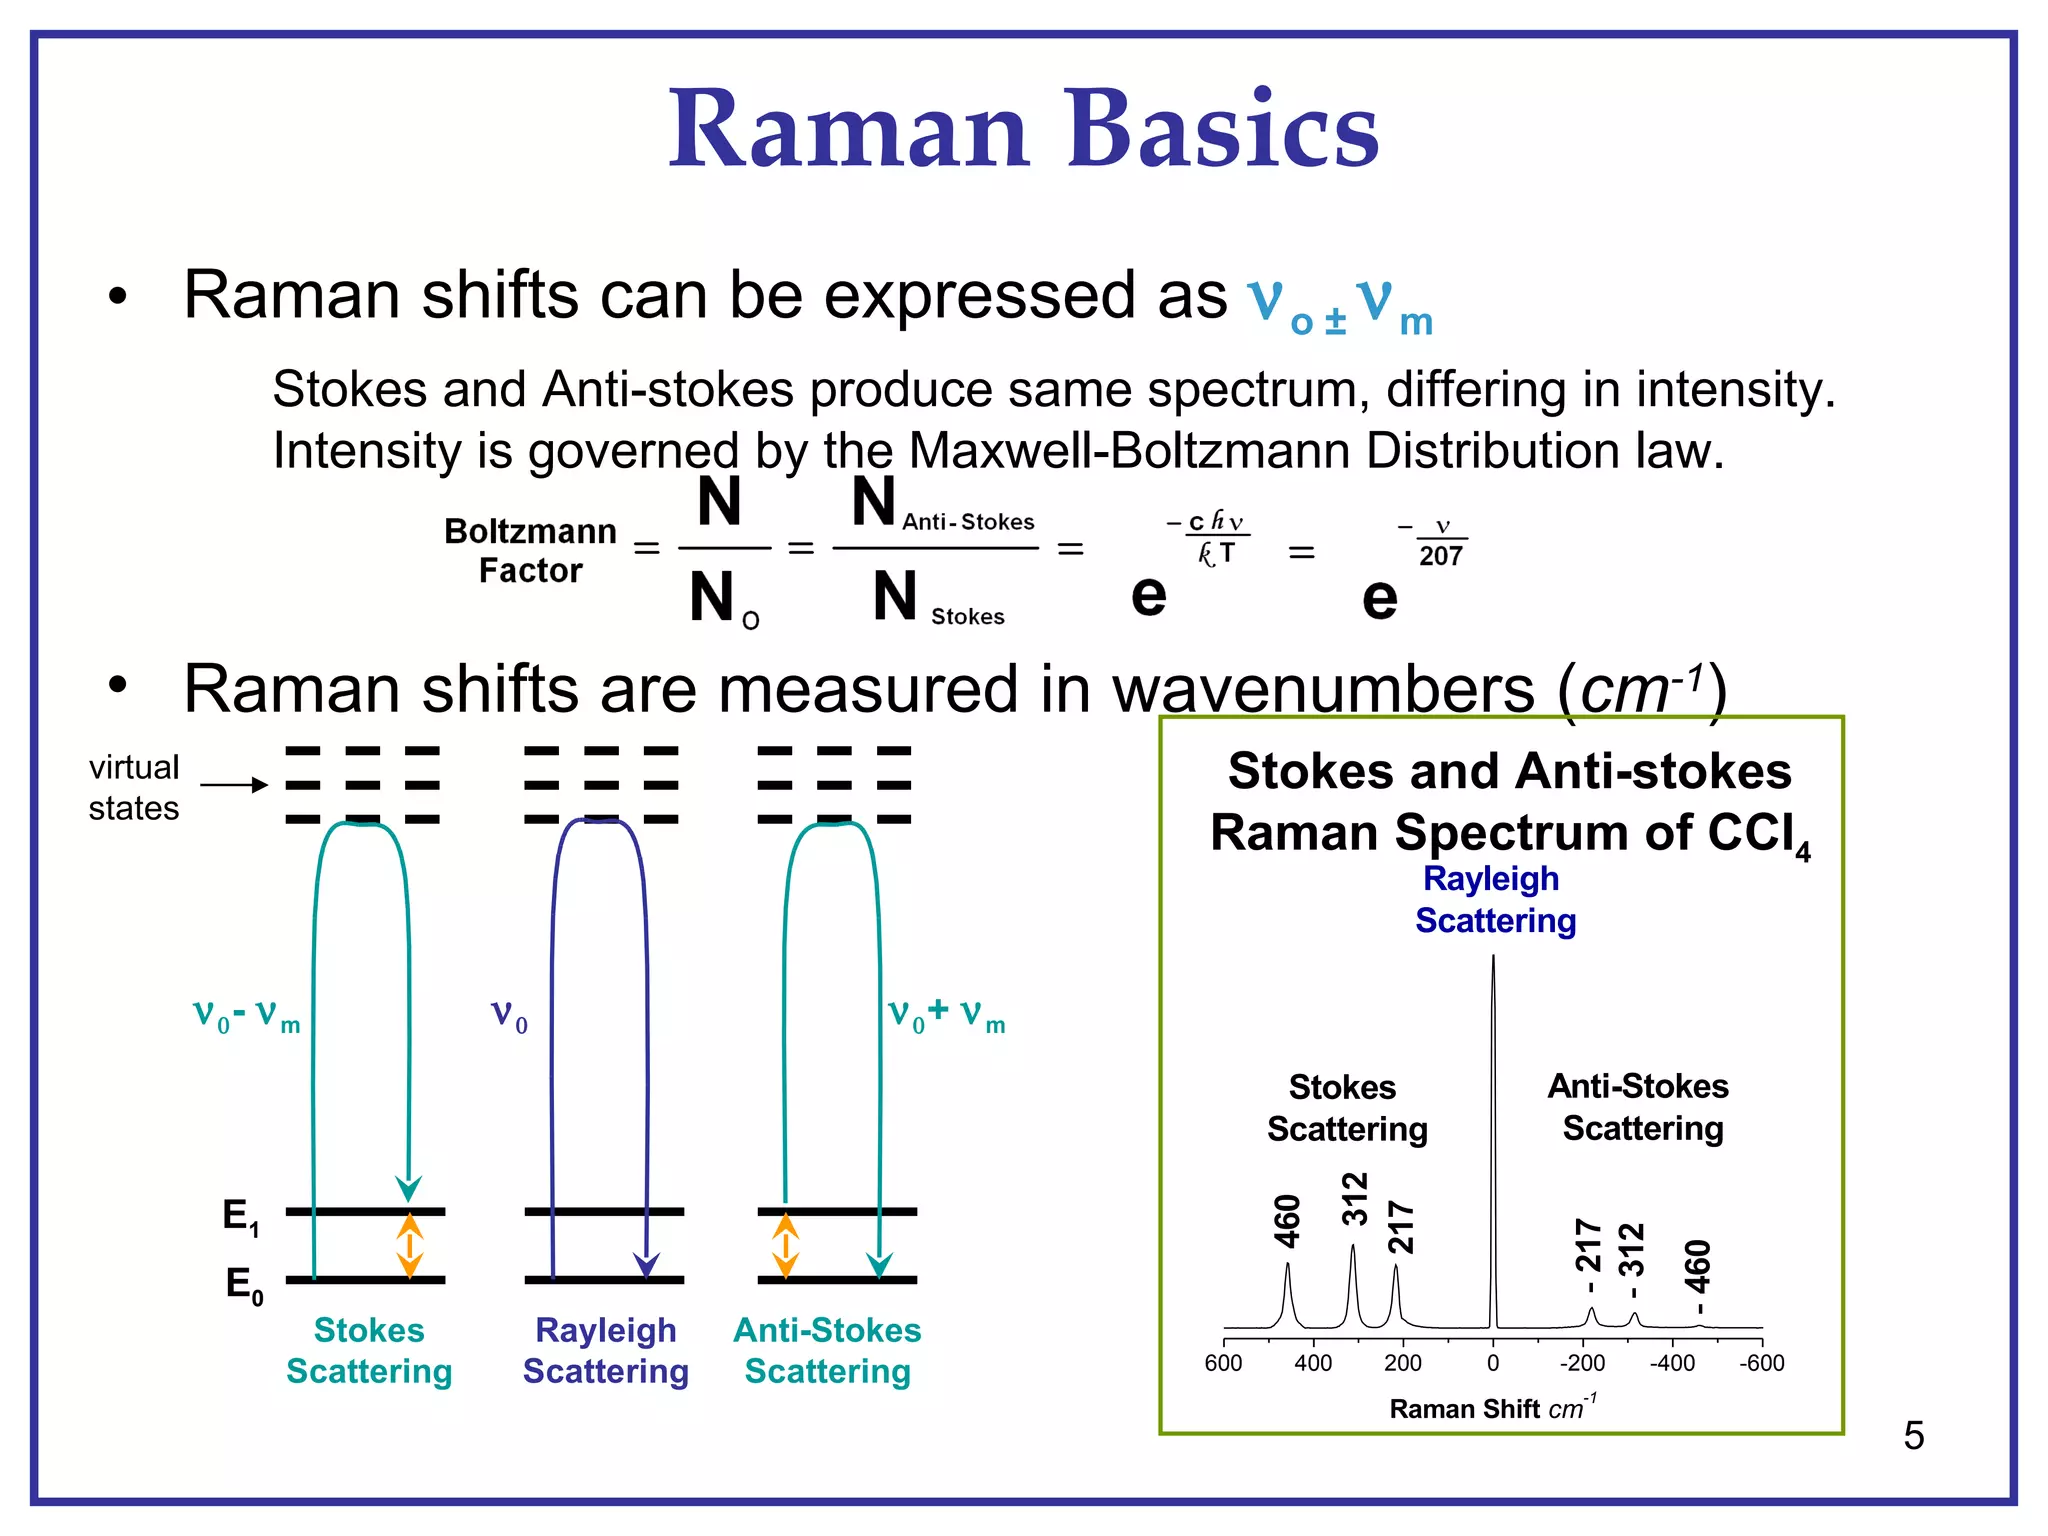
Since the intensity of the Raman scattering is directly proportional to the number of molecules available to participate in the process, the ratio of the anti-Stokes intensity () to the Stokes intensity () is also proportional to this population ratio.
The image below neatly summarizes the energy transitions for Stokes and anti-Stokes scattering and presents the resulting Boltzmann equation for their intensities.
2. Quantifying the Intensity Ratio
The video we watched in the last lesson also provides an excellent explanation for why the anti-Stokes intensity drops off exponentially. Let's watch the next segment of that video.
This clip from Thermo Scientific's 'Stokes and Anti-Stokes' video explicitly discusses how the Boltzmann distribution leads to an exponential decay in the intensity of anti-Stokes peaks, making them much weaker than Stokes peaks.
Please watch from 04:20 to 06:14. The speaker directly addresses the role of the Boltzmann distribution in determining the population of energy levels and the resulting impact on the anti-Stokes spectrum.
As the video and the equation in the image above explain, the relationship can be written as:
Here, we've substituted , which expresses the vibrational energy in terms of wavenumber (), the unit used in Raman spectra. A more complete form of the equation, which accounts for other frequency-dependent factors, is often presented as:
The pre-exponential factor, which accounts for the dependence of scattering intensity, is often close to 1 for small Raman shifts and is frequently ignored for estimations. The exponential term is the dominant factor.
Let's do a quick calculation to see the magnitude of this effect. Consider a typical skeletal vibration in a biological molecule, such as a C-C stretch, at at room temperature ().
- The ratio is
This calculation shows that the anti-Stokes peak has less than 1% of the intensity of the corresponding Stokes peak. This is why, for routine analysis, Raman spectra are almost always recorded on the Stokes side of the laser line—the signal is simply much stronger.
3. Turning a Bug into a Feature: Raman Thermometry
While the weakness of the anti-Stokes signal is a practical limitation, its direct and predictable dependence on temperature can be turned into a powerful analytical tool. By measuring the ratio for a given vibrational band, we can rearrange the Boltzmann equation to calculate the local temperature of the sample. This technique is known as Raman thermometry.
The following resource introduces this concept and provides the key equations.
Raman Thermometry: Understanding the Mathematics
This article from Spectroscopy magazine, 'Raman Thermometry', directly connects the anti-Stokes/Stokes ratio to temperature measurement. It provides the relevant equations and discusses the principle.
Please read the first two sections of the article, which introduce the concept and present the equations for temperature calculation. Pay attention to the discussion of how vibrational energy affects the anti-Stokes signal strength.
This application is particularly relevant for your interest in biological samples. When a high-power laser is focused on a sample, it can cause localized heating, potentially damaging the specimen or altering its chemical structure. This is a significant concern for living cells, such as the fungi you plan to study. Raman thermometry provides a non-contact method to monitor the sample's temperature in real-time during an experiment, allowing the operator to adjust laser power or acquisition time to prevent photodamage.
The image below shows experimental data illustrating how the Raman spectrum changes with temperature and how the intensity ratio can be used to calculate that temperature.
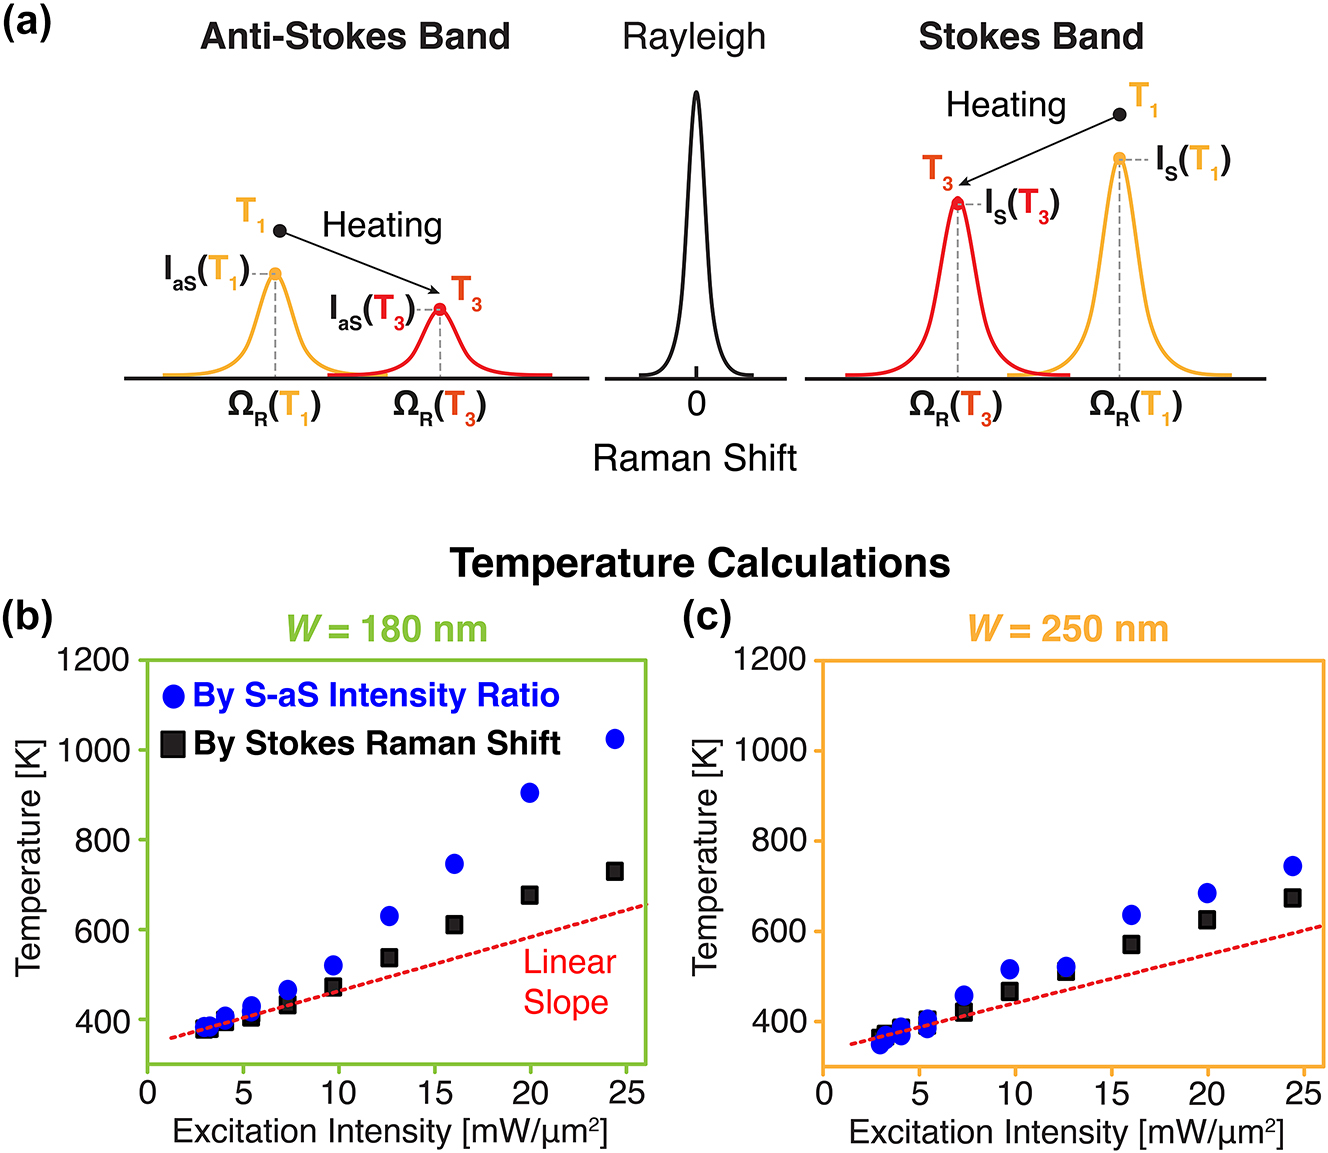
As you can see, the anti-Stokes signal, while weak, contains valuable information that complements the primary vibrational data from the Stokes signal.
Conclusion
This lesson concludes our first module by providing a quantitative explanation for one of the most fundamental features of a Raman spectrum: the intensity difference between Stokes and anti-Stokes bands.
Here are your key takeaways:
- The intensity ratio of anti-Stokes to Stokes peaks () is governed by the Boltzmann distribution, which describes the thermal population of vibrational energy levels.
- This ratio depends exponentially on both the vibrational frequency () and the absolute temperature (). For most vibrations at room temperature, the ratio is very small, making the anti-Stokes signal weak.
- This quantitative relationship explains the practical convention of measuring the more intense Stokes-shifted spectrum for routine analysis.
- The temperature dependence of the ratio enables the technique of Raman thermometry, a valuable tool for monitoring local sample temperature, especially in sensitive biological systems.
Looking Ahead
You have now completed the foundational principles of Raman scattering. You understand what it is, how it differs from IR, what makes a vibration Raman active, and the structure of a Raman spectrum.
In the next module, Raman Instrumentation and Experimental Design, we will move from theory to practice. The first lesson will compare the key components of a dispersive Raman spectrometer to those of an FT-IR instrument. Given your extensive experience with FT-IR, this will be a great opportunity to build on your existing knowledge of spectrometer design.