Hello! Welcome back to your course on UK electrical grids.
Introduction
In our last lesson, we saw that wind power has become the single largest source of electricity in the UK, a remarkable shift that is central to the country's decarbonization story. Now that we know how important it is, we need to understand how it actually works and behaves.
This lesson is dedicated to that topic. Our learning outcome is to: Describe the key operational characteristics of wind power, including variability, capacity factor, and the difference between onshore and offshore generation.
We will explore three core concepts:
- Variability: How a turbine's power output changes with wind speed.
- Capacity Factor: A key metric for measuring a wind farm's productivity.
- Onshore vs. Offshore: The crucial differences between wind farms built on land and those at sea.
Understanding these characteristics is essential for appreciating the challenges and opportunities that wind power presents to the electricity grid, a topic we will delve into in the next lesson.
1. Variability and the Wind Power Curve
The most fundamental characteristic of wind power is that it is variable. The amount of electricity a turbine produces depends directly on the speed of the wind, which is constantly changing. This relationship isn't linear; in fact, the power available in the wind is proportional to the cube of the wind speed. This means that a small increase in wind speed can lead to a much larger increase in potential power.
This relationship is formally described by a turbine's power curve. To understand this concept, please watch the first part of the following video from TU Delft.
Power curve and capacity factor - Sustainable Energy - TU Delft
This video explains the concept of a wind turbine's power curve, which is fundamental to understanding its operational characteristics.
Watch from the beginning to 04:33. Focus on understanding the three key operational points of the power curve: cut-in speed, rated power, and cut-out speed.
As the video explains, a wind turbine doesn't generate power at all wind speeds. The power curve shows three critical thresholds:
- Cut-in Speed (approx. 3-4 m/s): The minimum wind speed required to start the blades rotating and generate power.
- Rated Power Speed (approx. 12-17 m/s): The wind speed at which the turbine reaches its maximum designed power output. The turbine's control systems will prevent the power from exceeding this level to protect the generator.
- Cut-out Speed (approx. 25 m/s): The maximum safe wind speed. Above this speed, the turbine shuts down to prevent damage from excessive mechanical stress.
Because of this variability, the output from a single turbine can be quite volatile. However, when thousands of turbines are spread across a wide geographical area like the UK, the overall output becomes much smoother and more predictable. The wind is almost always blowing somewhere.
2. Capacity Factor: Measuring Productivity
Since a wind turbine doesn't operate at its rated (maximum) power all the time, we need a way to measure its actual productivity over a long period. This is where the capacity factor comes in.
The capacity factor is the ratio of the electricity a turbine actually produces over a period (e.g., a year) compared to the maximum amount it could have produced if it had run at its rated power continuously for that same period.
Let's watch the next segment of the same video to get a precise definition.
Power curve and capacity factor - Sustainable Energy - TU Delft
This part of the video clearly defines the capacity factor and explains what it represents.
Please watch from 04:33 to 05:57. Pay close attention to the definition and the key point that capacity factor is not a measure of a turbine's quality or efficiency.
A key takeaway is that a capacity factor is not a measure of efficiency. A perfectly engineered turbine will have a low capacity factor if it's placed in a location with little wind. It simply tells us how much of the turbine's potential was realised in its real-world environment.
So, what are typical capacity factors in the UK? This brings us to the major distinction between onshore and offshore wind.
3. Onshore vs. Offshore Generation
The UK has a large and growing fleet of both onshore (on land) and offshore (at sea) wind farms. While the basic principle is the same, their operational characteristics are very different.

Let's break down the key differences.
Wind Resource and Variability
The most significant difference is the wind itself. Offshore environments benefit from stronger and more consistent winds because there are no hills, buildings, or forests to obstruct the airflow.
Which is Best: Offshore or Onshore Wind Energy?
This video from Climate Club provides a concise comparison of the advantages and disadvantages of onshore and offshore wind, focusing on the differences in wind resource.
Watch the sections discussing the disadvantages of onshore wind (01:12 - 02:18) and the advantages of offshore wind (02:18 - 03:20). Note the comments on wind speed variability and consistency.
As the video highlights:
- Offshore: Wind speeds are higher and more consistent, leading to less variability and more predictable generation.
- Onshore: Wind is more prone to turbulence and variation, making output less steady.
Capacity Factors
This difference in wind resource has a direct impact on capacity factors. Because offshore turbines experience better wind conditions more of the time, they generate more electricity relative to their rated power.
How important are wind farms in achieving net zero?
This article from the University of Oxford provides typical capacity factor figures for the UK, directly comparing onshore and offshore performance.
Please read the paragraph under the heading 'How wind turbines work, and how efficient they really are' that begins 'There is a physical limit...'. Focus on the stated average capacity factors for UK offshore and onshore turbines.
The article confirms that UK offshore turbines have a much higher capacity factor (averaging over 40%) compared to onshore turbines (around 26%). The table below, from Wikipedia's data on UK wind power, shows this trend clearly with real data from recent years.
| Year | Capacity factor % (Onshore %, Offshore %) |
|---|---|
| 2020 | ~35.5 (28, 46) |
| 2021 | ~29.3 (23, 37) |
| 2022 | (27.3, 41.1) |
| 2023 | (24.5, 39.7) |
| (Source: Wikipedia, "Wind power in the United Kingdom", resource 24d11, part 1) |
Seasonal Alignment with Demand
A crucial operational characteristic for any power source is how well its output matches demand. In the UK, electricity demand is highest during the cold, dark winter months. Conveniently, this is also when wind speeds are at their highest.
The graph below illustrates this valuable alignment.
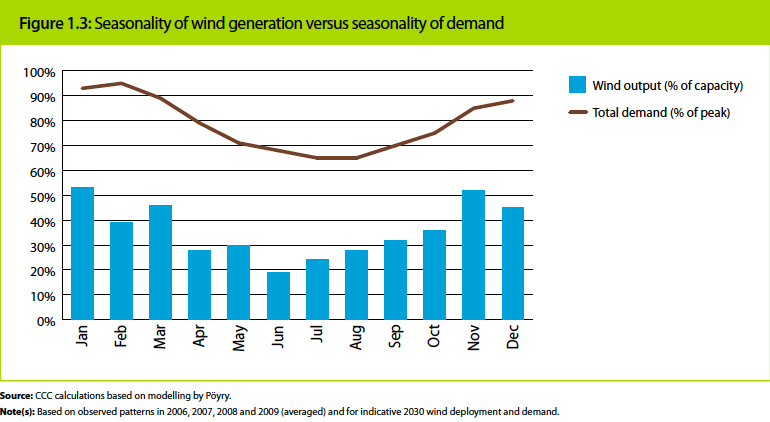
This natural correlation means that wind power is at its most productive precisely when the country needs it most, reducing the need for other forms of generation during peak periods.
Conclusion
In this lesson, we've dissected the key operational characteristics of wind power, the UK's primary source of electricity.
Key Takeaways:
- Wind power is inherently variable, with its output determined by a power curve that defines cut-in, rated, and cut-out wind speeds.
- Capacity factor is a measure of a wind farm's actual annual productivity, not its efficiency. It reflects the quality of the wind resource at a given site.
- Offshore wind farms in the UK have significantly higher capacity factors (around 40%) than onshore farms (around 26%) due to stronger, more consistent winds at sea.
- Wind generation in the UK has a favourable seasonal alignment with electricity demand, as both peak during the winter months.
Preview of the Next Lesson:
While wind power is a clean and increasingly cheap source of energy, its variability and other technical properties create new challenges for managing the electricity grid. In our next lesson, we will explore the main grid integration challenges of wind power, including its non-synchronous nature, impact on system inertia, and the need for curtailment.