Hello! Welcome to your next lesson on System Security and Protection.
In our last lesson, we discussed system strength and the short-circuit level, which describe the grid's inherent robustness and its ability to maintain a stable voltage during a fault. We saw that a "weak" grid is more fragile and prone to instability.
Today, we will explore a specific type of large-scale grid failure that is closely related to voltage stability: voltage collapse. Our goal is to describe the causes and prevention of voltage collapse in power systems. You'll learn what it is, why it's not just a simple power cut, and what measures are taken to prevent it.
The Cliff Edge: Power Transfer and Voltage Limits
At a very basic level, an electrical grid is like a plumbing system. Pushing more power (water) through a transmission line (pipe) causes the voltage (pressure) at the far end to drop. This is due to losses in the line itself. Normally, this drop is small and manageable.
However, there is a limit. If you try to push too much power through a line, the system can become unstable and enter a state of collapse.
To understand this, let's watch a segment from a video that explains this phenomenon using a helpful graph.
The Most Confusing Part of the Power Grid
The video 'The Most Confusing Part of the Power Grid' from the Practical Engineering channel provides an excellent visual explanation of the relationship between power transfer and voltage stability.
Watch the segment from 13:56 to 15:58. Focus on understanding the 'PV curve' and what happens at the 'nose of the curve'.
The concept introduced in the video is central to understanding voltage collapse. It's often visualized using a P-V curve, also known as a "Nose Curve".
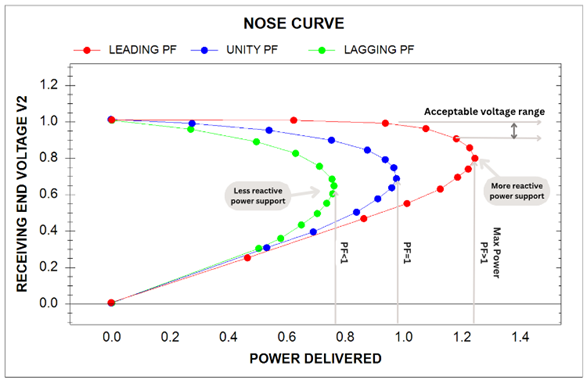
As you can see from the diagram:
- Stable Operation (Top of the curve): As we increase the power delivered, the voltage at the receiving end decreases. This is the normal, stable operating region of the power system.
- The 'Nose' (The tipping point): This is the maximum power that can be delivered to the load under the current system conditions. It represents the limit of stability.
- Unstable Operation (Bottom of the curve): If the system is pushed beyond the nose, it enters an unstable state. Any further increase in attempted power draw leads to a rapid and uncontrollable drop in voltage. This is voltage collapse. The system can no longer supply the required power, and the voltage plummets.
To see this in action, let's watch a short simulation.
Power system voltage stability [circuit simulator]
This video, 'Power system voltage stability', uses a circuit simulator to demonstrate the concept of the P-V curve. Don't worry about the specific circuit details; focus on the visual relationship between the power, current, and voltage as the system approaches the tipping point.
Watch from 00:44 to 04:10. Observe how, as the operator increases the power demand (the red curve rises), the voltage at the load (the blue curve) starts to drop. Notice how the voltage drop becomes more and more severe until the system hits the 'tipping point' and can no longer deliver more power.
The Root Cause: A Shortage of Reactive Power
So what determines where the "nose" of the curve is? Why can the grid sometimes deliver huge amounts of power with no problem, while at other times it seems to be closer to this cliff edge?
The answer is reactive power.
You may recall from Module 1 that power in an AC system has two components:
- Real Power (P): Measured in watts (W), this is the power that does useful work, like lighting a bulb or turning a motor shaft.
- Reactive Power (Q): Measured in volt-amps-reactive (VAR), this is the power that sustains the electric and magnetic fields needed for many devices to operate. It doesn't do "work" but is essential for the system to function.
Let's watch a quick refresher on this concept.
The Most Confusing Part of the Power Grid
We'll return to the Practical Engineering video for a clear, non-mathematical explanation of reactive power and why it matters for the grid.
Watch the segment from 08:24 to 13:23. Pay close attention to why reactive power, even though it isn't 'consumed', still puts a strain on grid infrastructure.
Voltage and reactive power are deeply connected. You can think of reactive power as the "pressure support" for the grid.
- Heavily loaded transmission lines consume reactive power.
- Many industrial loads (like large motors) also consume reactive power.
- This consumption "pulls down" the voltage.
- To counteract this, generators and other special devices must supply (or "inject") reactive power to "prop up" the voltage.
A voltage collapse occurs when the system's demand for reactive power exceeds the available supply. Without enough reactive power to support the voltage, the grid becomes weak and unstable, pushing the operating point over the nose of the P-V curve.
How a Collapse Unfolds: A Domino Effect
A full-scale voltage collapse is rarely a single event. It's usually a cascade that unfolds over several minutes.
Let's examine the process in more detail by reading an excerpt from a technical article.
Inside the power grid collapse and measures for ...
The article 'Inside the power grid collapse' from the Electrical Engineering Portal provides a clear, step-by-step example of how a voltage collapse can be triggered.
Please read sections 1.2 ('Maximum transmission capacity') and 1.3 ('A simple example of voltage collapse'). Focus on how the P-V curve changes when a generator hits its reactive power limit, and understand the sequence of events described in the example.
As the article explains, a typical sequence leading to collapse is:
- High Demand: The system is already heavily loaded, meaning lots of real and reactive power is flowing.
- Contingency: A critical piece of equipment is lost, for example, a major power line trips or a large generator goes offline.
- Overload: The power that was flowing through the lost equipment now has to re-route through the remaining lines, overloading them.
- Reactive Power Drain: These overloaded lines consume a huge amount of reactive power, causing system voltage to begin dropping.
- Generator Limits: Generators' automatic voltage regulators respond by producing more reactive power to support the voltage. However, generators have a physical limit to how much reactive power they can produce. One by one, they hit their limits.
- The Cascade: As each generator hits its limit, it can no longer support the voltage. This puts even more strain on the remaining generators, causing them to hit their limits even faster, like a line of dominos. The voltage starts to spiral downwards.
- Destabilizing Controls: To make matters worse, some automated equipment on the distribution network, like On-Load Tap Changers (OLTCs) on transformers, may try to correct the low voltage. They do this by adjusting the transformer to boost voltage for customers, but this action draws even more current from the already-struggling transmission grid, accelerating the collapse.
Test your understanding!
Imagine it's a hot, still summer afternoon. Demand for air conditioning is very high across the country. A large power station unexpectedly trips offline.
Why is this situation at high risk of leading to a voltage collapse? Think about the key ingredients.
Show answer
This situation is high-risk because it combines the main ingredients for voltage collapse:
- High Demand: Air conditioners are motor-based loads, which consume significant reactive power. The overall system is already heavily loaded.
- Contingency: The loss of a large power station is a major contingency.
- Reactive Power Strain: The lost generation and its reactive power support must be replaced by other generators, and power must be re-routed, further straining the transmission lines. This creates a massive demand for reactive power at a time when the system is already stressed.
Prevention: Managing Voltage and Reactive Power
System operators like National Grid ESO work continuously to prevent voltage collapse by ensuring there is always enough reactive power reserve to handle contingencies.
A new approach to managing voltage and reactive power
This short article from National Grid ESO explains in simple terms why they manage reactive power and how the sources of it are changing in the UK.
Read the first two sections, 'What is reactive power and why is it important?' and 'What’s changing and why?'. This will connect the concepts we've learned to the real-world operations of the UK grid.
The main strategies for preventing voltage collapse fall into two categories: planning and real-time operation. This involves deploying a range of devices to supply or absorb reactive power.
The Most Confusing Part of the Power Grid
Let's conclude by watching the final segment of the Practical Engineering video, which shows the common technologies used for voltage support.
Watch from 15:58 to 18:04. This will introduce you to the hardware used to prevent voltage collapse.
The key tools used to prevent voltage collapse are:
- Synchronous Generators: These are the traditional workhorses, providing both real power and crucial reactive power support.
- Shunt Capacitors: Large banks of capacitors installed in substations. They are switched on to inject reactive power and boost voltage during times of high demand.
- Shunt Reactors: The opposite of capacitors. These are large coils that are switched on to absorb reactive power and reduce voltage during times of very light load (e.g., at night), when voltages can become too high.
- Synchronous Condensers: You'll remember these from our previous lesson. They are large spinning machines dedicated to providing reactive power and system strength, able to both inject and absorb it dynamically.
- Static VAR Compensators (SVCs) & STATCOMs: These are advanced power-electronic devices that can inject or absorb reactive power very quickly and precisely, providing excellent dynamic voltage support.
Conclusion
Today we've unpacked the complex and critical issue of voltage collapse. Unlike a simple outage from a tripped line, it is a system-wide instability that can lead to widespread, prolonged blackouts.
Key Takeaways:
- Voltage collapse is a rapid, uncontrollable drop in voltage caused by a lack of reactive power support on a heavily loaded grid.
- The P-V (Nose) curve is a fundamental tool for visualizing the stability limit of power transfer. Operating beyond the "nose" leads to collapse.
- The primary cause is an imbalance between the demand for reactive power (from lines and loads) and the supply (from generators and other devices).
- A collapse often unfolds as a cascade, triggered by a contingency (like a line or generator trip) that leads to generators hitting their reactive power limits one after another.
- Prevention relies on careful planning and the deployment of reactive power compensation devices like capacitors, reactors, synchronous condensers, and SVCs to maintain a healthy voltage profile and sufficient stability margin.
In our next lesson, we will move from system-level security issues to focus on the equipment that protects individual components. We will explain the operation of overcurrent protection schemes for transmission and distribution lines.