Hello! This course is a short route from a defensible forecast to a media plan. First, you will check whether the available numbers can support a ₹30 lakh monthly forecast and show what happens when traffic becomes more expensive or checkout improves. The next lesson will use that forecast to allocate the budget across channels and set November decision rules.
You do not need to resolve every data gap before submitting the assignment. You need a sheet that distinguishes supplied figures from calculations and assumptions—and makes the consequences of those assumptions visible. Allow roughly 35–40 minutes for this lesson and the sheet build.
1. Establish which numbers are comparable
A forecast for a D2C travel-goods store can be compact: media spend buys clicks; some clicks become store sessions; some sessions produce orders; orders generate revenue. The difficult part is not the multiplication. It is avoiding comparisons between figures with different denominators, periods, or attribution scopes.
For example, cost per order is media spend divided by orders. Customer acquisition cost (CAC) concerns new customers, not all orders, and a reported CAC may include costs beyond media spend. A returning customer’s order belongs in the order count but not the new-customer count. Consequently, a reported “CAC” should remain a reported input until you know exactly how it was calculated.
6 Conversion Metrics Ecommerce Stores Should Track (2026) - Shopify
Read Shopify’s metric definitions to establish the denominators your sheet will use. In particular, notice why sessions are not the same as shoppers, and why CAC is not automatically cost per order.
Under “6 conversion metrics to track,” read subsections “1. Conversion rate” and “2. Average order value,” from conversion through AOV. Then read subsection “6. Customer acquisition cost,” from CAC and its inputs. Use the displayed AOV formula: revenue divided by orders is a mean, despite a sentence in the article calling it a median.
For this assignment, keep three labels distinct:
The second formula is only a comparable ad-only CAC when spend and first-time customers cover the same period and attributed population. It need not match a company-reported CAC that includes other sales and marketing costs. A discrepancy is a prompt to investigate, not permission to silently replace the supplied number.
2. Build a small reconciliation panel
Open a blank Google Sheet. Put the following labels in column A and the available figures in column B. The figures below are illustrative placeholders, not company data; replace them with the assignment’s supplied figures, leaving unknown cells blank.
| Row | Column A: historical input | Column B: illustration |
|---|---|---|
| 2 | Historical paid media spend | ₹24,00,000 |
| 3 | Historical paid orders | 2,000 |
| 4 | Historical paid first-time customers | 1,500 |
| 5 | Reported CAC | ₹900 |
| 6 | Reported cost per order, if supplied | ₹1,000 |
| 7 | Historical paid sessions | 100,000 |
| 8 | Reported paid conversion rate | 2.4% |
| 9 | Historical paid revenue | ₹84,00,000 |
| 10 | Reported paid AOV | ₹4,500 |
Before using any figures together, write their date range, source, and scope alongside them in column C—for example, whether an order count comes from the store or an ad platform. “Paid” above is a proposed common scope, not a claim about the figures you have received.
Add these calculated row labels in A11:A19: Calculated cost per order; Calculated ad-only new-customer CAC; Customers implied by reported CAC; Calculated conversion rate; Calculated AOV; Cost-per-order check; CAC check; CVR check; AOV check. Paste the corresponding formulas into B11:B19, one per row:
=IFERROR(B2/B3,"")
=IFERROR(B2/B4,"")
=IFERROR(B2/B5,"")
=IFERROR(B3/B7,"")
=IFERROR(B9/B3,"")
=IF(OR(B6="",B11=""),"MISSING",IF(ABS(B6-B11)>MAX(1,0.01*B11),"CHECK","OK"))
=IF(OR(B5="",B12=""),"MISSING",IF(ABS(B5-B12)>MAX(1,0.01*B12),"CHECK","OK"))
=IF(OR(B8="",B14=""),"MISSING",IF(ABS(B8-B14)>0.001,"CHECK","OK"))
=IF(OR(B10="",B15=""),"MISSING",IF(ABS(B10-B15)>MAX(1,0.01*B15),"CHECK","OK"))
Format rates as percentages and money as rupees. The check thresholds merely prevent tiny rounding differences from creating noise; they are not proof that “OK” figures have matching scopes.
With the illustration, calculated cost per order is ₹1,200, while the reported figure is ₹1,000. Calculated ad-only new-customer CAC is ₹1,600, while reported CAC is ₹900. The reported CAC would imply roughly 2,667 new customers if ₹24 lakh were its numerator—more than the 2,000 orders in this illustration. That is especially worth questioning if all figures truly describe the same paid population and period. Calculated CVR is 2%, rather than the reported 2.4%; calculated AOV is ₹4,200, rather than ₹4,500.
A concise assignment note would read: “Reported CAC, CVR, AOV and cost per order do not all reconcile to the supplied paid-media totals. Forecast assumptions are stated separately; confirm reporting period, attribution scope, first-time-customer definition and revenue basis before treating the historical figures as comparable.”
3. Forecast the same ₹30 lakh under three conditions
The baseline answers: What would the budget produce at our stated working assumptions? The downside answers: What if buying traffic costs more and conversion weakens? The improved-checkout case answers: What if we buy the baseline traffic but recover some orders already lost in checkout?
Enter these assumptions, not claimed historical facts, in column B:
| Row | Assumption | Illustrative value |
|---|---|---|
| 22 | Monthly media budget | ₹30,00,000 |
| 23 | Baseline cost per click | ₹25 |
| 24 | Click-to-session rate | 80% |
| 25 | Baseline session conversion rate | 2% |
| 26 | AOV | ₹4,500 |
| 27 | Sessions that start checkout | 20% |
| 28 | Share of otherwise-abandoned checkouts recovered by cost transparency | 1.5% |
| 29 | Share of remaining abandoned checkouts recovered by easier guest checkout | 1% |
Why include both clicks and sessions? An ad click need not produce a measured store session. The click-to-session rate makes that gap explicit rather than quietly treating clicks as visits. Likewise, the 20% checkout-start rate is a working assumption used to estimate the population available for checkout fixes. Replace it with observed checkout starts if you have them. The baseline CVR must not exceed the checkout-start rate; otherwise, these assumptions are inconsistent.
Put Baseline, Downside, and Improved checkout in B31:D31. Put the following labels in A32:A50, then enter the formulas shown in B32:B50. Copy B32:B50 across to columns C and D.
| Row | Column A | Formula in column B |
|---|---|---|
| 32 | Spend | =$B$22 |
| 33 | Cost per click | =$B$23 |
| 34 | Click-to-session rate | =$B$24 |
| 35 | Pre-fix session CVR | =$B$25 |
| 36 | Checkout-start rate | =$B$27 |
| 37 | AOV | =$B$26 |
| 38 | Clicks | =IFERROR(B32/B33,"") |
| 39 | Sessions | =B38*B34 |
| 40 | Checkout starts | =B39*B36 |
| 41 | Orders before fixes | =B39*B35 |
| 42 | Abandoned checkouts before fixes | =MAX(0,B40-B41) |
| 43 | Orders recovered: cost visibility | =0 |
| 44 | Orders recovered: easier checkout | =0 |
| 45 | Forecast orders | =SUM(B41,B43:B44) |
| 46 | Effective session CVR | =IFERROR(B45/B39,"") |
| 47 | Forecast revenue | =B45*B37 |
| 48 | Calculated media cost per order | =IFERROR(B32/B45,"") |
| 49 | Revenue divided by media spend | =IFERROR(B47/B32,"") |
| 50 | Checkout completion rate | =IFERROR(B45/B40,"") |
Now change C33 to 30, C34 to 75%, and C35 to 1.75%. These are explicit downside assumptions, not external benchmarks. Keep the other downside inputs unchanged so you can see the effect of costlier traffic, fewer measured sessions per click, and weaker conversion without also changing the budget or AOV.
For the improved-checkout column, keep baseline traffic and pre-fix CVR. Replace just two formulas:
- D43:
=D42*$B$28 - D44:
=MAX(0,D42-D43)*$B$29
The second fix acts on remaining abandonments. This avoids counting the same recovered order twice. The forecast is expressed in expected orders, so decimals are acceptable inside the model; display rounded orders for presentation, but retain unrounded formulas for revenue and cost per order.
Your illustration should be close to:
| Result | Baseline | Downside | Improved checkout |
|---|---|---|---|
| Sessions | 96,000 | 75,000 | 96,000 |
| Expected orders | 1,920 | 1,313 | 2,349 |
| Revenue | ₹86.40 lakh | ₹59.06 lakh | ₹105.72 lakh |
| Media cost per order | ₹1,563 | ₹2,286 | ₹1,277 |
| Revenue ÷ media spend | 2.88 | 1.97 | 3.52 |
In the improved case, the two fixes recover approximately 259 and 170 orders respectively: about 429 additional expected orders and ₹19.32 lakh additional gross revenue versus baseline. This is not incremental profit. It excludes implementation costs, any shipping subsidy, returns, and any effect on AOV or margin. “Revenue divided by spend” is likewise a revenue efficiency measure, not ROI or proof of profitability.
4. Defend the two non-media fixes without overstating the evidence
A checkout forecast is more persuasive when its proposed interventions address identifiable friction. The chart below reports reasons respondents gave for abandoning an online purchase; respondents could select multiple reasons.
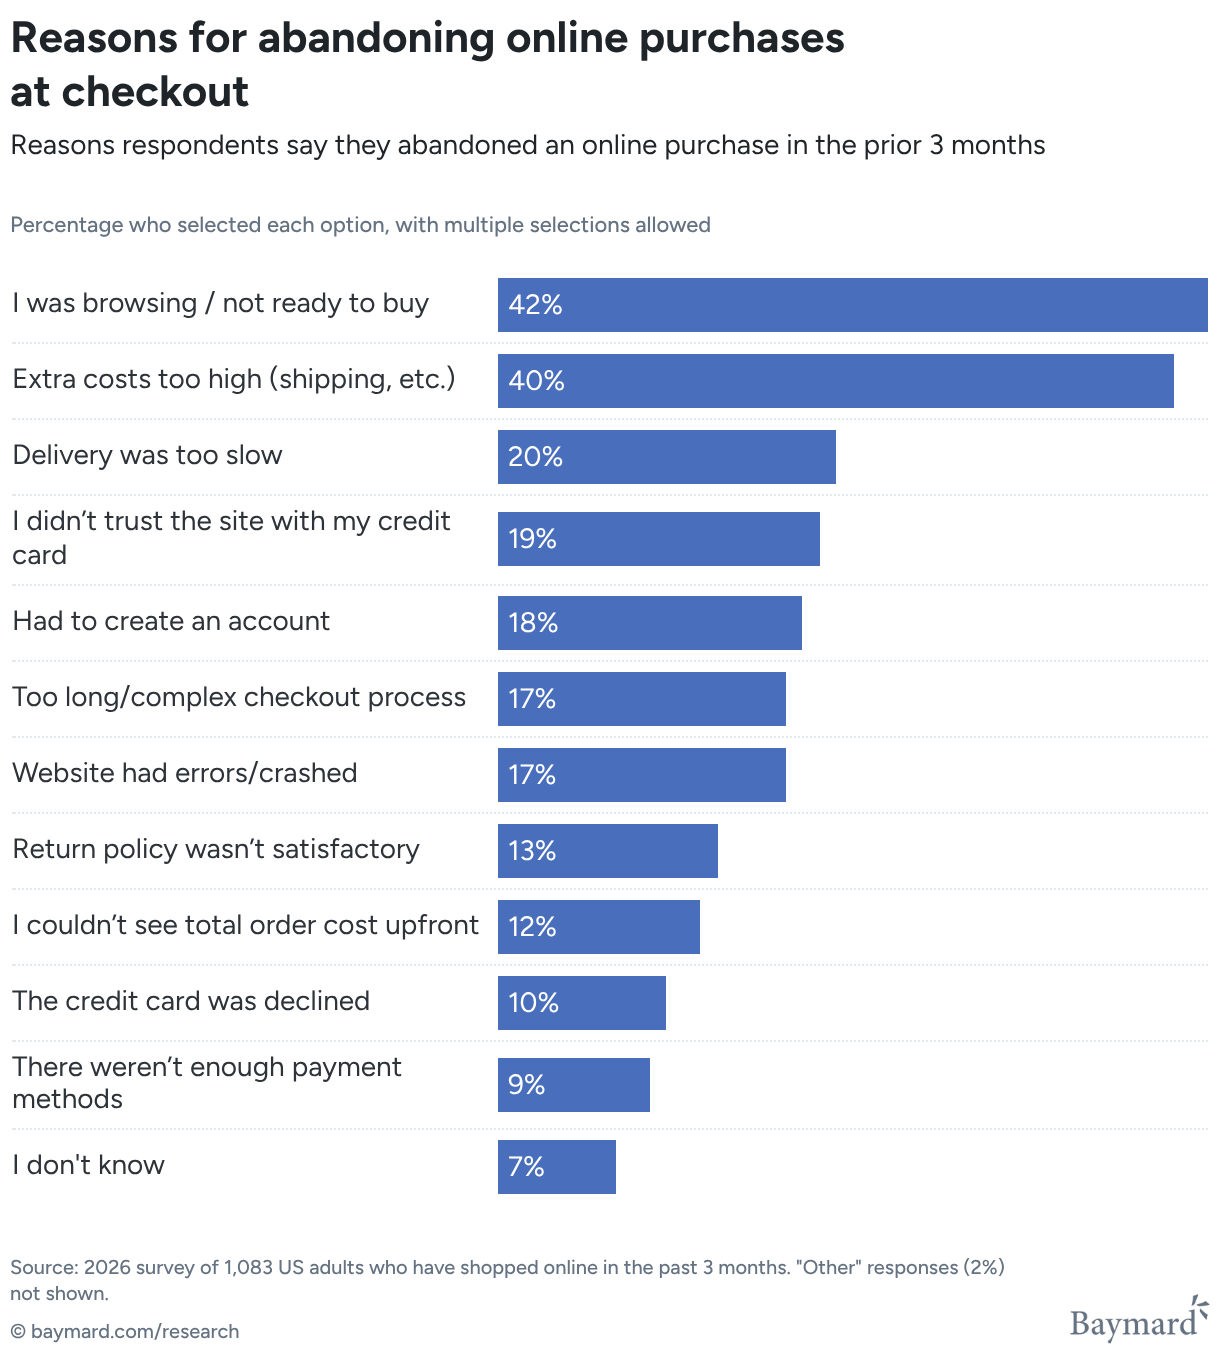
The chart makes unexpected costs and account or checkout friction reasonable places to investigate. It does not justify using its 40% or 18% response shares as conversion lifts. Some shoppers were merely browsing, respondents could select several reasons, and this store’s checkout may differ from those surveyed.
How to Reduce Cart Abandonment (Data-Backed UX Strategies) – Baymard
Read Baymard’s proposed remedies and its example of valuing a small recovery of addressable abandonments. Use the research to choose what to inspect, not to claim that your assumed lift is guaranteed.
Under “1. Unexpected costs appear too late,” read from cost visibility and fixes. Under “2. Forced account creation,” read from guest-checkout friction. Later on the page, find the paragraph beginning “Start by refining how you report abandonment” and read the recovery example; focus on how an assumed share of addressable abandonments becomes an order and revenue estimate.
For the assignment, prioritize the fixes as conditional recommendations:
- Show the full order cost and shipping terms earlier. Inspect the cart and mobile checkout first. If fees appear late, show an accurate total or clear estimate and shipping threshold before payment. The model’s 1.5% recovery of otherwise-abandoned checkouts is an assumption to test, not a research finding.
- Remove avoidable account and form friction. If account creation is required or the guest option is hard to find, make guest checkout prominent. If guest checkout is already clear, prioritize a demonstrable obstacle instead, such as unnecessary fields or broken autofill. The model’s 1% recovery applies only to abandonments left after the first fix.
This ordering gives the forecast an operational meaning: verify that a problem exists, implement a targeted change, then compare checkout completion while watching AOV and margin. If checkout starts are unavailable, present the recovery estimates as especially tentative rather than disguising the assumed 20% start rate as observed behavior.
What to take into the media plan
You now have a compact sheet with two distinct jobs. The reconciliation panel records where historical figures need clarification, without calling reported CAC “cost per order.” The scenario panel holds spend constant at ₹30 lakh and makes the baseline, downside, and two checkout improvements comparable. For the submission, label every placeholder and assumption plainly; the credible claim is what the budget could produce under specified conditions, not that the illustrated outputs are promised results.
Next, you will turn these scenario-wide totals into a November channel and testing allocation, with weekly pacing and rules for when to move spend—or hold it back.