Hello! Welcome to the next lesson in our DAX mastery journey.
In the last lesson, we put the final piece of our data model's foundation in place by creating and verifying the relationship between our Date table and the Sales table. This connection is the engine that will power all of our time-based analysis.
Today, we will leverage that foundation to begin our formal study of Time Intelligence. Our goal is to calculate Year-to-Date (YTD), Quarter-to-Date (QTD), and Month-to-Date (MTD) values. These are some of the most fundamental and frequently requested KPIs in business analytics, as they provide a clear view of performance within a specific period. You'll learn how to write measures that track revenue as it accumulates throughout the month, quarter, and year.
1. Understanding Period-to-Date Calculations
Before we write any DAX, let's clarify what "period-to-date" means. It's a cumulative calculation that starts at the beginning of a given period (like a month, quarter, or year) and ends at the latest date currently being considered.

This cumulative view is essential for answering questions like:
- "Are we on track to meet our monthly sales goal?"
- "How is our performance this quarter shaping up compared to the last?"
- "What is our total revenue for the year so far?"
2. The Theory: Table Functions vs. Syntactic Sugar
In DAX, there are two primary ways to calculate period-to-date values. Understanding both is key to mastering the "why" behind your code, which aligns with your preference for a theory-first approach.
Method 1: The Core Mechanism (CALCULATE + DATES...)
The "engine" behind these calculations is a combination of CALCULATE and a set of table functions: DATESYTD, DATESQTD, and DATESMTD.
- These
DATES...functions don't perform a calculation themselves. Instead, they return a table containing a single column of all the dates within the specified period. - You then use this table as a filter inside a
CALCULATEfunction to modify the filter context.
For example, CALCULATE([Total Revenue], DATESYTD('Date'[Date])) tells DAX: "Calculate the total revenue, but first, ignore the current date filter and replace it with a new filter containing all dates from the start of the year to the last visible date."
Method 2: The Shortcut (TOTAL...)
Because this pattern is so common, DAX provides a set of simpler functions: TOTALYTD, TOTALQTD, and TOTALMTD. These are often called "syntactic sugar" because they are just a more convenient way to write the same logic.
When you write TOTALYTD([Total Revenue], 'Date'[Date]), the DAX engine translates it behind the scenes into CALCULATE([Total Revenue], DATESYTD('Date'[Date])).
To see this in action, the following video from the experts at SQLBI provides an excellent explanation of this relationship.
DATESMTD, DATESQTD, DATESYTD, TOTALMTD, TOTALQTD, TOTALYTD - DAX Guide
This video clarifies the difference between the DATESYTD family of functions and the TOTALYTD family, explaining why the latter is considered a convenient shortcut.
Please watch the following segments: 00:00 to 01:06: Introduces the DATESYTD, DATESQTD, and DATESMTD functions and what they return. 01:06 to 02:04: Explains how TOTALYTD and similar functions are 'syntactic sugar' for a CALCULATE expression. 03:22 to 04:14: Reinforces the crucial point that these functions return a table to be used as a filter argument in CALCULATE.
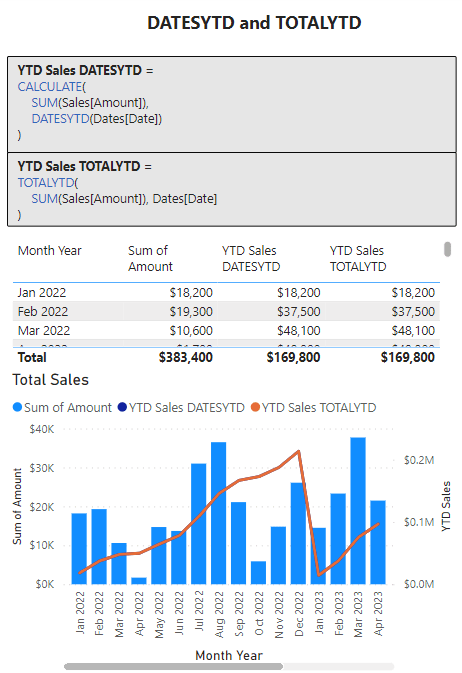
The image below perfectly summarizes this. It shows both DAX patterns for YTD, the resulting table of values, and a chart visualizing the accumulation. As you can see, the result is identical.
For our practical exercises, we will use the simpler TOTAL... functions, but it's vital to remember the underlying CALCULATE logic they represent.
3. Practical Application: Building Your Measures
Let's now create these measures in your Power BI file. The following video provides a practical walkthrough which you can follow. We will create a measure for MTD, QTD, and YTD sales.
How to calculate MTD QTD YTD in Power BI DAX Tutorial (6/50)
This tutorial from 'Analytics with Nags' provides a clear, step-by-step guide to creating MTD, QTD, and YTD measures.
Watch from 01:48 to 09:15 to see how to create all three measures. You can pause the video after each section to create the measure in your own file.
Here are the formulas and steps for you to follow.
Step 1: Create Sales MTD
First, create a new measure for Month-to-Date sales.
Sales MTD =
TOTALMTD(
    [Total Revenue],
    'Date'[Date]
)
To verify it:
- Create a new Table visual.
- Add
'Date'[Date]to the columns. - Add your
[Total Revenue]and[Sales MTD]measures. - Observe how
[Sales MTD]accumulates daily revenue and resets to zero on the first day of each new month.
Step 2: Create Sales QTD
Next, create the Quarter-to-Date measure. The structure is identical.
Sales QTD =
TOTALQTD(
    [Total Revenue],
    'Date'[Date]
)
To verify it:
- Add the
[Sales QTD]measure to your table. - Notice that it accumulates just like MTD, but it only resets on the first day of a new quarter (January 1st, April 1st, July 1st, October 1st).
Step 3: Create Sales YTD
Finally, create the Year-to-Date measure.
Sales YTD =
TOTALYTD(
    [Total Revenue],
    'Date'[Date]
)
This measure will accumulate revenue continuously from January 1st until the end of the year.
For an alternative text-based reference with these examples, you can consult this article.
Time Intelligence Functions in Power BI - AlmaBetter
The article 'Time Intelligence Functions in Power BI' by AlmaBetter provides concise syntax and examples for these functions.
Review the sections 'TOTALYTD' and 'Implementing YTD, QTD, and MTD Measures' for quick, text-based examples of the functions we've just used.
4. A Key Business Variation: Fiscal Years
Your TOTALYTD calculation currently assumes the year starts on January 1st. However, many companies operate on a fiscal year that ends on a different date (e.g., March 31st or June 30th). The TOTALYTD function gracefully handles this with an optional third argument.
Let's assume our business's fiscal year ends on March 31st.
Sales YTD (Fiscal) =
TOTALYTD(
    [Total Revenue],
    'Date'[Date],
    "3-31"
)
The third argument, "3-31", is a string that tells DAX the year-end date is March 31st. When you use this measure, the YTD calculation will now accumulate from April 1st and reset on that date every year.
This video segment clearly demonstrates how to implement this and shows the difference in a visual.
How to calculate MTD QTD YTD in Power BI DAX Tutorial (6/50)
Continuing with the 'Analytics with Nags' video, this final segment shows how to use the optional third parameter of TOTALYTD to handle fiscal years.
Watch from 11:50 to 14:15. Pay close attention to the syntax of the third argument ("3-31") and how it changes the starting point of the YTD calculation from January to April.
This is a powerful feature that makes your analysis much more relevant to specific business contexts.
Conclusion
In this lesson, you've mastered one of the cornerstones of time intelligence. You can now build measures that provide a running total of performance within key business periods.
Key Takeaways:
- Period-to-date functions (
MTD,QTD,YTD) calculate cumulative totals from the start of a period to the current date. - Functions like
TOTALYTDare convenient syntactic sugar for the more fundamentalCALCULATE(..., DATESYTD(...))pattern. - These functions require a proper Date table and a valid relationship to your fact table to work correctly.
- The
TOTALYTDfunction can be adapted for fiscal years by providing an optional year-end date argument (e.g.,"3-31").
Preview of the Next Lesson:
Knowing the YTD sales is useful, but the real power comes from comparison. In our next lesson, we will build upon what we've learned today to calculate values for the prior year and prior month. This will enable us to compute critical growth metrics like Year-over-Year (YoY) and Month-over-Month (MoM), moving us closer to your goal of mastering advanced business calculations.