Hello! Welcome back to your DAX training.
Introduction
In our last lesson, we explored the critical difference between the filter context and the row context. We established that while simple aggregations like SUM work within the filter context, they fail when a calculation needs to be performed for each row before the final aggregation. You learned that iterator functions, like SUMX, are the solution because they create a temporary row context inside a measure.
Today, we move from theory to practice. This lesson is all about applying that knowledge to solve real-world business problems. You will learn how to write measures using SUMX and its counterpart, AVERAGEX, to perform essential row-level calculations. Specifically, we'll focus on calculating total revenue by multiplying price and quantity—a fundamental task for any data analyst working with sales or logistics data.
By the end of this lesson, you will have written your first iterator-based measures and will be able to confidently use SUMX and AVERAGEX to derive powerful insights that are impossible to achieve with simple aggregations alone.
The Challenge: Calculating Revenue Without a Revenue Column
Let's revisit our business scenario. We are analyzing sales data, and our Sales fact table contains OrderQuantity and UnitPrice, but it's missing a pre-calculated Revenue column for each transaction. Our goal is to create a Total Revenue measure.
As we discovered, this formula fails because a measure doesn't have a native row context:This will fail --> 'Sales'[OrderQuantity] * 'Sales'[UnitPrice]
And this formula is mathematically incorrect:This is wrong --> SUM('Sales'[OrderQuantity]) * SUM('Sales'[UnitPrice])
The correct approach is to iterate through the Sales table, calculate Quantity * Price for each row, and then sum up those individual results. This is precisely what SUMX is designed for.
Writing Your First SUMX Measure
The SUMX function follows a simple but powerful syntax:
SUMX(<table>, <expression>)
<table>: The table you want to iterate over, row by row.<expression>: The calculation you want to perform for each of those rows.
So, to calculate our total revenue, the measure would be:
Total Revenue =
SUMX (
    'Sales',
    'Sales'[OrderQuantity] * 'Sales'[UnitPrice]
)
This measure instructs the DAX engine to:
- Go to the
Salestable. - For the very first row, calculate
OrderQuantity * UnitPrice. - For the second row, do the same.
- Continue this for every row in the
Salestable (that is visible in the current filter context). - Finally, sum up all of the individual results to get the grand total.
To see a clear, step-by-step demonstration of this process, the following video from SQLBI is invaluable. It shows why the simple multiplication fails in a measure and how SUMX elegantly solves the problem.
This clip from the SQLBI video 'Row Context in DAX' perfectly demonstrates the problem of missing row context and the solution using SUMX.
Please watch the following segments: Start at 05:34 and watch until 09:57. This part shows the error you receive when trying a row-level calculation in a measure. The narrator explains why it fails—DAX can't determine a single value for the column without a row context. Continue from 09:57 to 11:56. Here, the video introduces SUMX as the solution. Observe how it takes the Sales table and the multiplication expression as its two arguments to produce the correct result.
To reinforce this concept and your preference for understanding the "why," the following reading provides a detailed breakdown of how SUMX works.
How to Use the SUMX Power BI Functions - DataCamp
The article 'How to Use the SUMX Power BI Functions' from DataCamp provides an excellent written guide that complements the video.
Please read the following sections: 'How SUMX Works in Power BI': Focus on the 'Row context' and 'Filter context' subsections. This reinforces the core theory of how iterators function. 'SUMX vs SUM': This section provides a direct comparison, clarifying when to use each function. 'Implementing SUMX in Power BI: Step-by-Step Guide': Read 'Step 1: Creating a measure using SUMX'. This provides a practical example very similar to our own revenue calculation.
Expanding the Logic with AVERAGEX
Now, what if the business question changes? Instead of total revenue, management wants to know the average revenue per transaction line.
If we simply used AVERAGE, we could only find the average quantity or the average unit price, neither of which is what we need. We need to perform the same row-by-row calculation as before (OrderQuantity * UnitPrice), but instead of summing the results, we need to find their average.
This is where AVERAGEX comes in. It has the exact same syntax and logic as SUMX:
AVERAGEX(<table>, <expression>)
Our measure for average revenue per transaction would be:
Average Revenue per Transaction =
AVERAGEX (
    'Sales',
    'Sales'[OrderQuantity] * 'Sales'[UnitPrice]
)
Just like SUMX, AVERAGEX iterates through the Sales table, calculates the revenue for each row, and then takes the arithmetic mean of all those individual results.
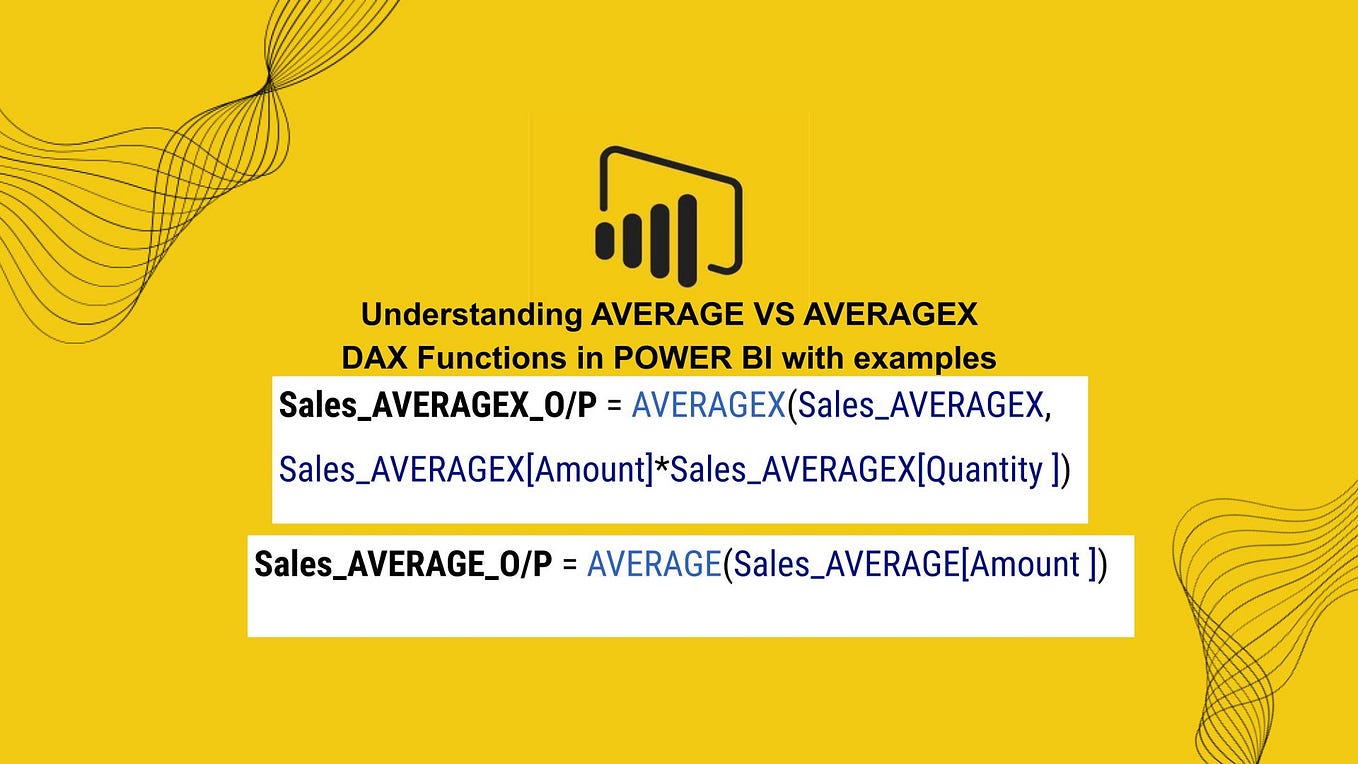
The image below visually contrasts the simple AVERAGE function with the more powerful AVERAGEX iterator, showing how AVERAGEX can handle an expression with multiple columns.
For a detailed guide on using AVERAGEX, the following resource breaks it down clearly.
The article 'Dax Function: AVERAGEX' from Lets-viz.com is a focused and practical guide to this function.
Please review the following parts of the article: Introduction and Purpose: Read the initial paragraphs to understand the function's goal. 'How Does AVERAGEX Dax Function Works?': This section explains the row-by-row evaluation process. 'Examples': Focus on the 'Basic Usage' example, which calculates the average price per unit sold—a very similar calculation to our average revenue.
Practical Application
It's time to apply what you've learned in Power BI.
- Open your
AdventureWorks Sales Analysis.pbixfile. - Navigate to the Report View and create a new table visual.
- In the Data pane, right-click on the
Salestable and select New measure. - Write the
Total Revenuemeasure using theSUMXformula we discussed. Remember to format it as a currency.Total Revenue = SUMX( 'Sales', 'Sales'[OrderQuantity] * 'Sales'[UnitPrice] ) - Create another new measure in the
Salestable forAverage Revenue per TransactionusingAVERAGEX. Format this as currency as well.Average Revenue per Transaction = AVERAGEX( 'Sales', 'Sales'[OrderQuantity] * 'Sales'[UnitPrice] ) - Drag
Product[Category]into your new table visual. - Now, drag your two new measures,
Total RevenueandAverage Revenue per Transaction, into the visual. - Observe the results. Notice how DAX correctly calculates the total and average revenue for each product category by applying the filter context from the table visual before your iterator functions perform their row-by-row calculations.
Conclusion
In this lesson, you've made a significant leap from theory to practice by writing your first iterator function measures.
Key Takeaways:
SUMXandAVERAGEXare iterator functions (or "X-functions") that perform calculations on a row-by-row basis before aggregating the results.- They solve the problem of performing multi-column arithmetic inside a measure by creating a temporary row context.
- The syntax for both is similar:
FUNCTION(<table>, <expression>). - These functions are fundamental for a vast range of business calculations, from simple revenue to complex weighted averages.
Preview of the Next Lesson:
Now that you have a solid grasp of SUMX and AVERAGEX, we will explore more advanced applications. In the next lesson, we'll learn how to calculate weighted averages, a common requirement in financial and operational analysis. We'll also introduce the FILTER function, which will allow you to create much more complex and dynamic filtering conditions within your DAX measures.