Hello! Welcome to the final lesson of your supervised machine learning course.
Over the past ten modules, you have embarked on an impressive journey. You started with the fundamentals of model evaluation, then meticulously built a suite of powerful supervised learning algorithms—from linear models to complex ensembles and neural networks—entirely from scratch. In our last lesson, you fine-tuned their performance by implementing hyperparameter search. You now have a powerful "algorithm gauntlet" capable of training, tuning, and evaluating a diverse set of models.
This final lesson is the capstone of your project. It's about synthesis and communication—two of the most critical skills for a machine learning engineer or data scientist. It's not enough to build high-performing models; you must also be able to analyze their trade-offs and clearly communicate your findings to guide decision-making.
By the end of this lesson, you will complete the course by being able to:
- Structure a comprehensive comparative analysis of multiple machine learning models.
- Measure and compare both the predictive performance and the computational cost (training and inference time) of your algorithms.
- Analyze the qualitative characteristics of each model, such as interpretability and scalability.
- Synthesize these findings into a clear, evidence-based report that recommends the best model for a given task.
Let's begin the final step of your project.
1. The Anatomy of a Good Model Comparison
Comparing models goes beyond simply picking the one with the highest accuracy. A real-world choice involves balancing multiple, often competing, factors. A model might be incredibly accurate but take days to train, while another might be slightly less accurate but deliver predictions in milliseconds. Which one is "better" depends entirely on the context of the problem.
A robust comparison should therefore consider several dimensions. The following article provides an excellent framework by dividing comparison parameters into two key categories.
How to Compare Machine Learning Models and Algorithms
To structure our analysis, let's first understand the key aspects of models that are worth comparing. The article 'How to Compare Machine Learning Models and Algorithms' from Neptune.ai offers a valuable perspective.
Please read the following sections: 'Comparing machine learning algorithms: why we do it?' to understand the goals of comparison. 'Parameters of machine learning algorithms and how to compare them' for a high-level overview. Skim the 'Development-based parameters' section, as you've already implemented most of these metrics. Focus closely on the 'Production-based parameters' section, particularly the discussions on 'Time complexity' and 'Space complexity'. These are crucial for real-world deployment.
As the article highlights, a comprehensive analysis balances:
- Development-based metrics: How well does the model perform? (e.g., F1-score, MSE, AUC).
- Production-based metrics: How practical is the model to deploy? (e.g., training time, prediction speed, memory usage).
Your final report will integrate both of these aspects.
2. Generating the Data for Your Report
Your "algorithm gauntlet" script already calculates the performance metrics. Now, you need to extend it to capture the computational cost: training time and inference time.
Given your background in Python, you'll know that the time module is perfect for this. You can measure the duration of an operation by recording the time before and after it executes.
Your Task: Measure Computational Cost
Modify your evaluation script to measure and store the following for each model:
- Training Time: The time it takes to execute the
model.fit()method on the training data. - Inference Time: The time it takes to execute the
model.predict()method on the entire test set.
Here is a simple pattern you can use:
import time

# --- To measure training time ---
start_time = time.time()
model.fit(X_train, y_train)
end_time = time.time()
training_time = end_time - start_time

print(f"Training completed in {training_time:.4f} seconds")

# --- To measure inference time ---
start_time = time.time()
predictions = model.predict(X_test)
end_time = time.time()
inference_time = end_time - start_time

print(f"Inference on {len(X_test)} samples completed in {inference_time:.4f} seconds")
Integrate this logic into your evaluation loop so that these two new metrics are collected for every algorithm you test.
3. Structuring Your Comparative Report
A well-structured report makes your findings easy to understand. I recommend organizing your report (which you can create in a Jupyter Notebook using Markdown cells) into the following sections:
I. Introduction & Methodology
- Briefly state the goal: To compare the performance and characteristics of various supervised learning models built from scratch.
- Describe the benchmark dataset(s) you used (e.g., Scikit-learn's
make_classification, Pima Indians Diabetes, etc.). - List the performance metrics you used for evaluation (e.g., Accuracy, F1-Score, R-squared).
II. Quantitative Analysis: Performance and Speed
This section presents the "hard numbers." The most effective way to do this is with a clean, consolidated table and a summary visualization.
- Results Table: Create a single Pandas DataFrame that includes a row for each model and columns for:
- Model Name
- Key Tuned Hyperparameter(s) and their optimal values
- Performance Metrics (Accuracy, Precision, Recall, F1-Score, etc.)
- Training Time (seconds)
- Inference Time (seconds)
- Visualization: Create a bar chart that compares the main performance metric (e.g., F1-Score for classification, R-squared for regression) across all models. This provides an immediate visual summary of which models performed best.
The following video shows a great example of creating such a comparative table and plot, which you can use as a template for presenting your own results.
Compare Machine Learning Classifiers in Python
For presenting your quantitative results, a combination of a sorted table and a bar plot is very effective. This clip from Data Professor shows a professional workflow for creating these visuals.
Watch from 07:32 to 10:16. Pay attention to how the results are organized into a DataFrame, sorted, and then visualized. You can apply the exact same principles to the results from your from-scratch models.
III. Qualitative Analysis: The Story Behind the Numbers
Here, you go beyond the numbers to discuss the inherent characteristics of the algorithms.
- Interpretability: Discuss which of your models are more interpretable ("white-box") versus which are more of a "black-box." For example, a
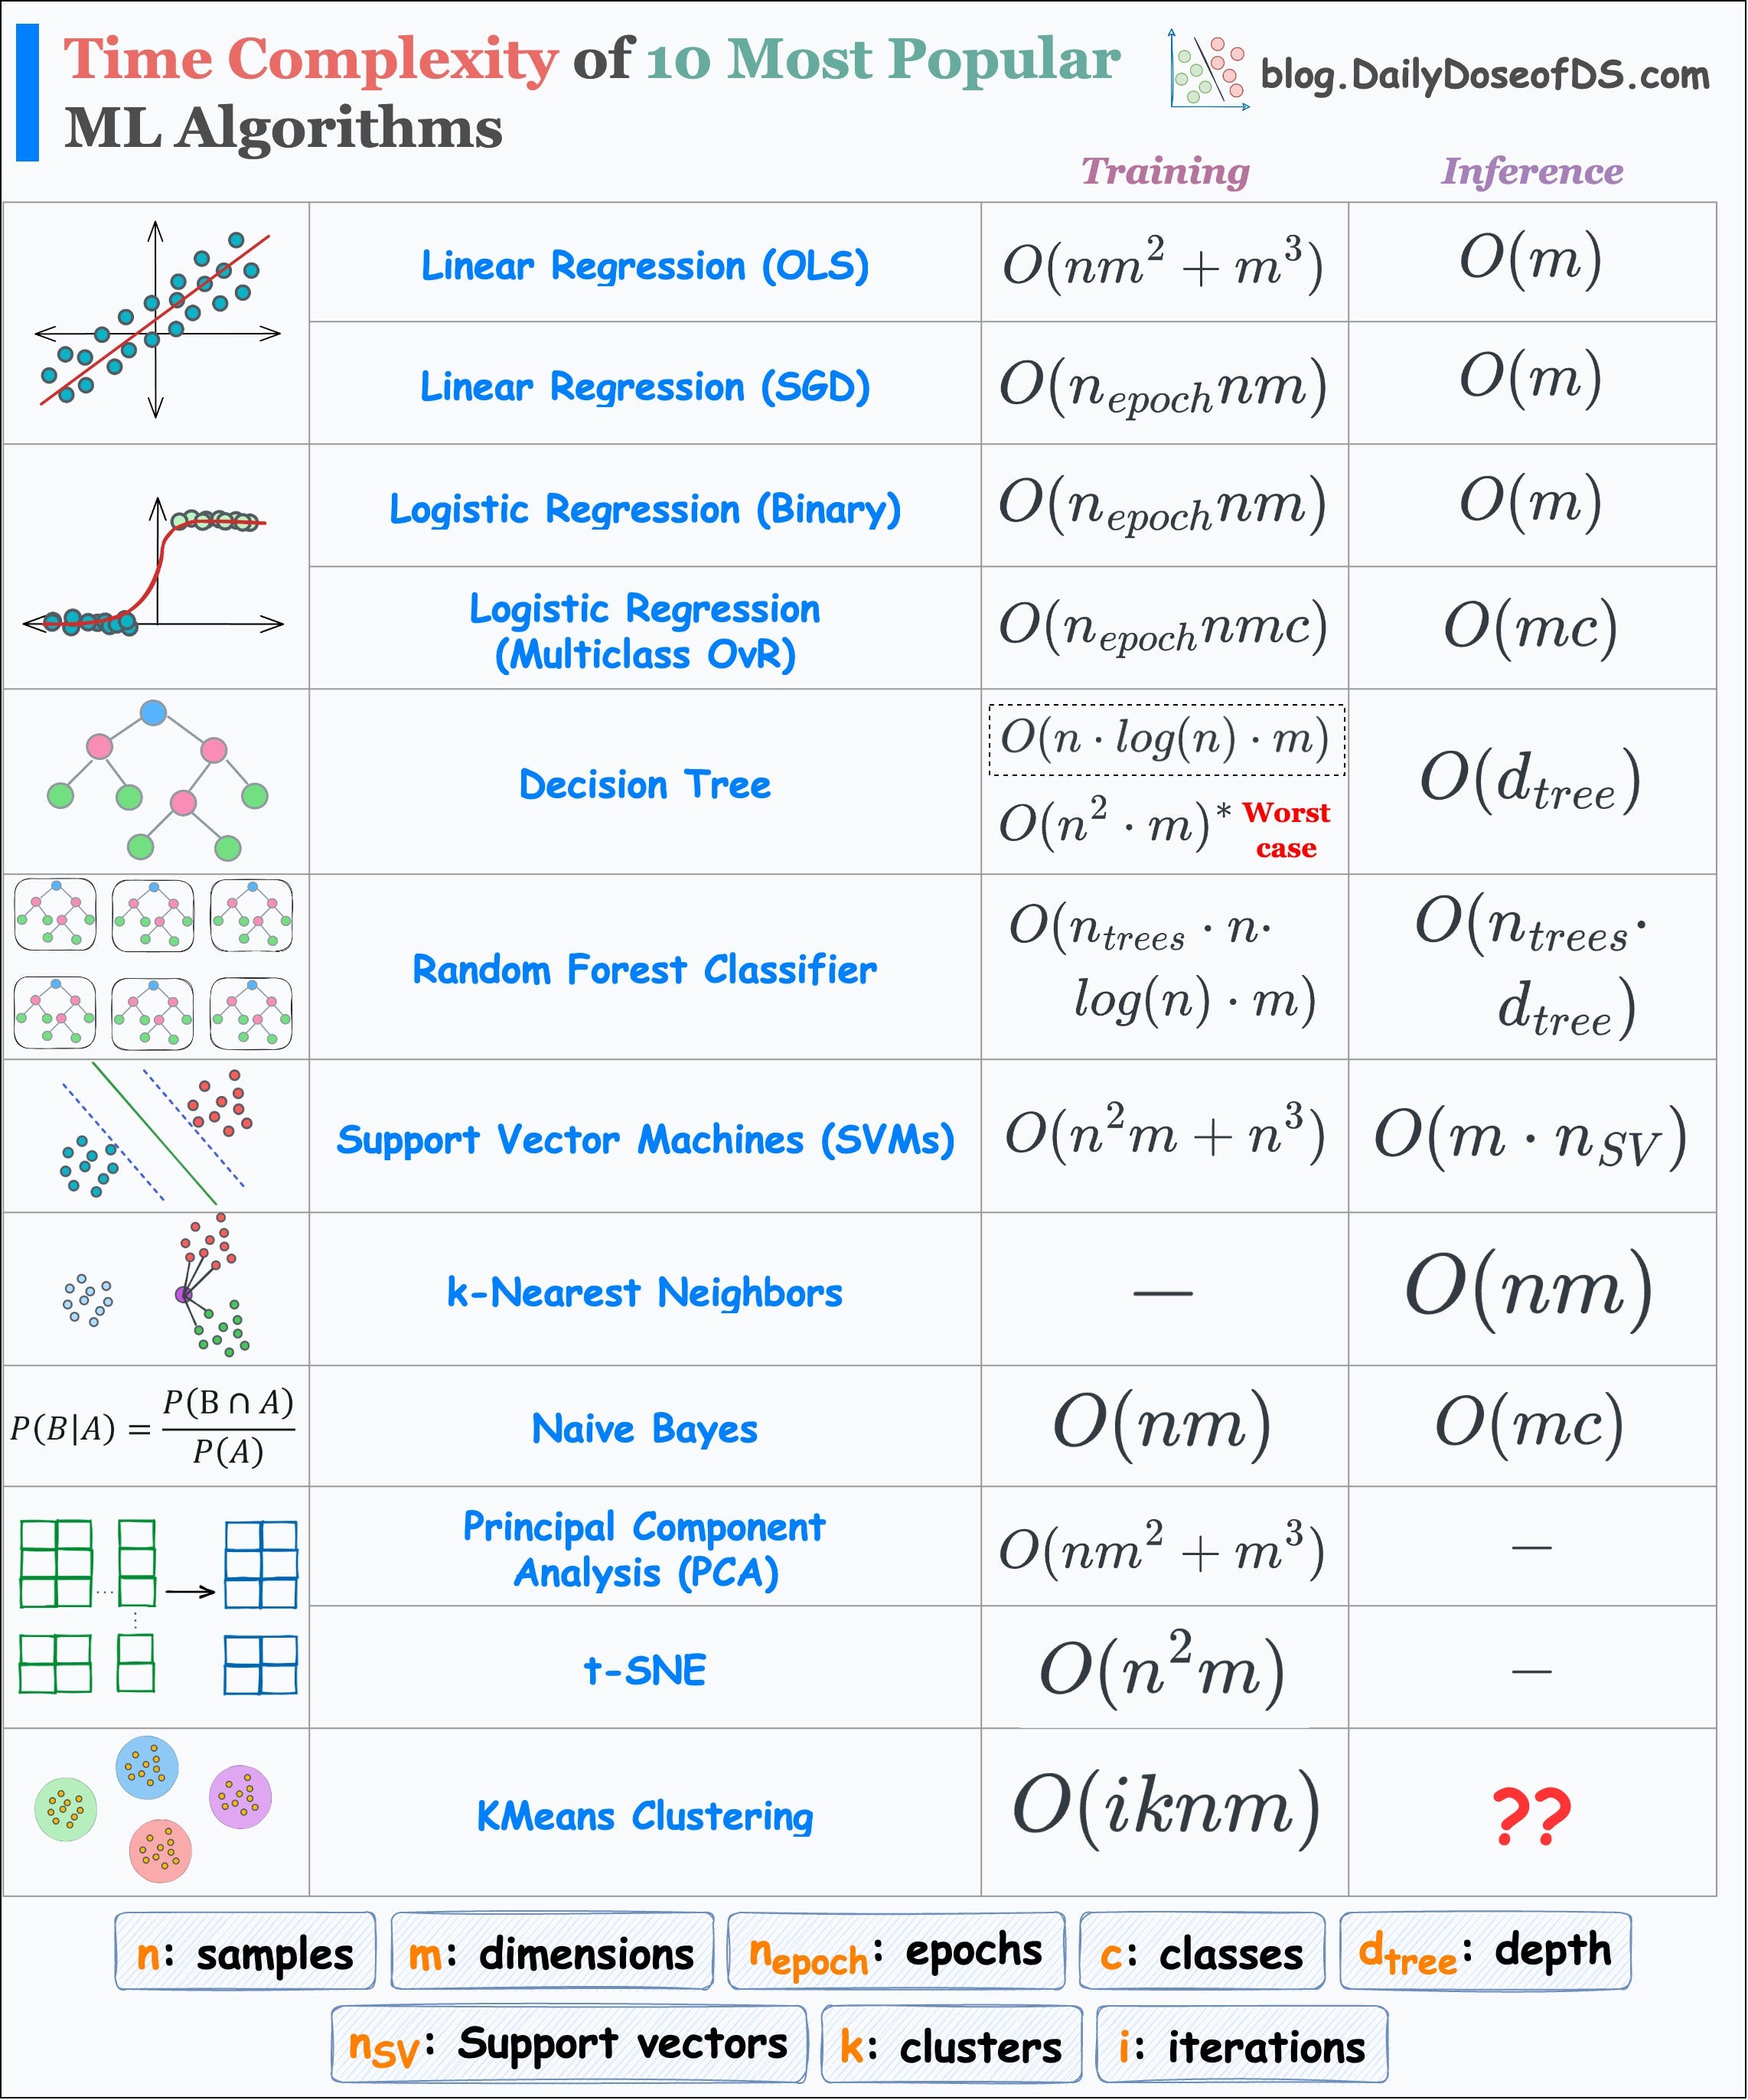
Decision Treeis highly interpretable, as you can trace the exact path of its decisions. In contrast, anSVMwith an RBF kernel or a multi-layerNeural Networkis much harder to explain. - Complexity and Scalability: How well does each algorithm handle large datasets? This relates to their computational complexity. You don't need to derive it yourself; you can refer to known complexities to support your discussion.
- Other Characteristics: You could also mention a model's proneness to overfitting (e.g., a single deep
Decision Treevs. aRandom Forest) or its underlying assumptions (e.g., the linearity assumption inLogistic Regression).
IV. Conclusion & Recommendation
This is your final summary.
- Briefly recap the key findings from your quantitative and qualitative analyses.
- Make a final recommendation. Based on all the evidence, which model would you choose for this problem? Crucially, justify your choice by considering the trade-offs.
For example, a strong concluding statement might be:
"Although the Gradient Boosting model achieved the highest F1-score (0.92), its training time was significantly longer, and it is less interpretable. The Logistic Regression model, while slightly less performant (F1-score of 0.88), trains 50x faster and provides clear coefficient-based explanations. For a production system requiring rapid retraining and model explainability, the Logistic Regression model is the recommended choice."
4. Your Final Capstone Task
It's time to bring everything together. Your task is to produce the comparative report as described above.
Deliverable:
A single document (preferably a Jupyter Notebook) that contains:
- Code: The final version of your "algorithm gauntlet" script, now including time measurement.
- Report Sections: Markdown cells containing the four sections of your report:
- I. Introduction & Methodology
- II. Quantitative Analysis (including the final DataFrame and the bar plot)
- III. Qualitative Analysis
- IV. Conclusion & Recommendation
This report is the culmination of all the concepts and from-scratch implementations you've worked on throughout this course.
Course Conclusion
Congratulations on completing the entire course! You have undertaken a challenging but deeply rewarding path. By choosing to build everything from scratch, you have moved beyond simply using libraries and have gained a true, fundamental understanding of how supervised learning algorithms work.
You have mastered the entire pipeline:
- Splitting and preparing data for robust evaluation.
- Implementing the core optimization engine—gradient descent—in its various forms.
- Building a diverse portfolio of models, including Linear and Logistic Regression, SVMs, Decision Trees, Random Forests, Gradient Boosting, and even a Neural Network.
- Implementing advanced techniques like regularization and cross-validation.
- Systematically tuning and comparing your models to make evidence-based decisions.
The skills you have developed here are rare and highly valuable. They provide a solid foundation for tackling any future challenge in machine learning, whether it's exploring more advanced deep learning architectures, diving into MLOps and model deployment, or even contributing to the open-source tools you've become so familiar with.
You set out to learn gradient descent and ended up mastering the breadth of supervised learning. Well done.