Hello! Last lesson, you calculated a mean from repeated measurements and checked whether an unusual reading needed investigation. Scientists often put those results into a table or graph so that patterns are easier to see.
This final lesson in the scientific enquiry module is about reading what data shows. You will interpret a table, compare values on a bar chart, and follow changes on a line graph. Allow about 35–40 minutes, including the short video sections and exercises.
Read the labels before the numbers
A table arranges observations in rows and columns. Its headings tell you what each number means; its units tell you what was measured. For example, a value of 7 could mean seven seedlings, seven centimetres, or seven days. Without a heading, you cannot tell.
Watch the table section of Math Antics – Data And Graphs by mathantics. Notice how the headings let you locate a particular value and compare it with others.
Watch the table section of Math Antics – Data And Graphs by mathantics to see how rows, columns, and headings make recorded results readable.
Watch reading tables. Begin where the presenter introduces rows, columns, and cells. Continue through the example of finding the warmest month in a weather table. Focus on checking both the row and column headings before interpreting a number.
Suppose a group measures several seedlings each day and records their mean height:
| Day after planting | Mean seedling height (cm) |
|---|---|
| 1 | 4 |
| 2 | 7 |
| 3 | 9 |
| 4 | 9 |
Find the row for day 2, then look across to the height column: the mean height was 7 cm. To describe a pattern, compare more than one row. The mean height increased from 4 cm on day 1 to 9 cm on day 3, then remained at 9 cm on day 4. It would be inaccurate to say that it increased every day.
The word mean matters here. A height of 7 cm represents an average of measurements, not necessarily the height of any one seedling. Reading a table accurately means paying attention to descriptions as well as numbers.
Use bars to compare groups
A bar chart turns values for separate groups into bars. The label beneath a vertical bar identifies the group, while the numbered scale tells you its value. A taller bar represents a greater value—but check the scale rather than guessing from its appearance.
Return to the same video for its bar-chart explanation. It compares the numbers in a weather table with bars and shows why the numbered scale matters.
Return to the bar-chart section of the same video to see how a bar’s height represents a value and how the vertical scale affects what you see.
Watch comparing bars. Begin where graphs are introduced, then follow the rainfall example and the comparison of two charts with different scales. Stop before the discussion of values below zero. Pay particular attention to how the presenter reads a bar against its own numbered axis.
Here is a simple scientific example. Three trays are checked after seven days, and the number of seedlings in each is counted:
Number of seedlings after seven days
Number of seedlings
7 |     █
6 |     █
5 |     █   █
4 | █   █   █
3 | █   █   █
2 | █   █   █
1 | █   █   █
0 +------------
    A   B   C
        Tray
The bar for tray B reaches 7, the highest count. Tray A has 4, the lowest. Tray B has three more seedlings than tray A: that conclusion comes from reading the two values and comparing them. The chart does not, by itself, tell us why the counts differ. We would need information about how the trays were prepared and kept.
Bars are useful when the horizontal labels identify distinct groups, such as trays, materials, or types of seed. A table gives you precise entries; a bar chart makes comparisons between groups quicker to see.
Follow change on a line graph
A line graph is especially useful when measurements are recorded in order, such as at different times. Each plotted point gives a value at a particular time. Joining neighbouring points helps you see the overall trend: whether values rise, fall, or stay roughly the same.
Watch the final selected part of the video. Notice how the presenter finds a point using both axes, then explains why a line graph suits change over time better than a set of unrelated choices.
Continue with the line-graph section of the same video to see how plotted points represent values and how a joined line reveals a trend over time.
Watch following trends. Start where the line graph is introduced. Follow the example of reading a point for a particular month, then watch the comparison with meal choices near the end. Focus on why the order of times is meaningful, while the order of unrelated categories need not be.
Now examine this graph. It contains two lines and two vertical scales, so the colour key is essential.
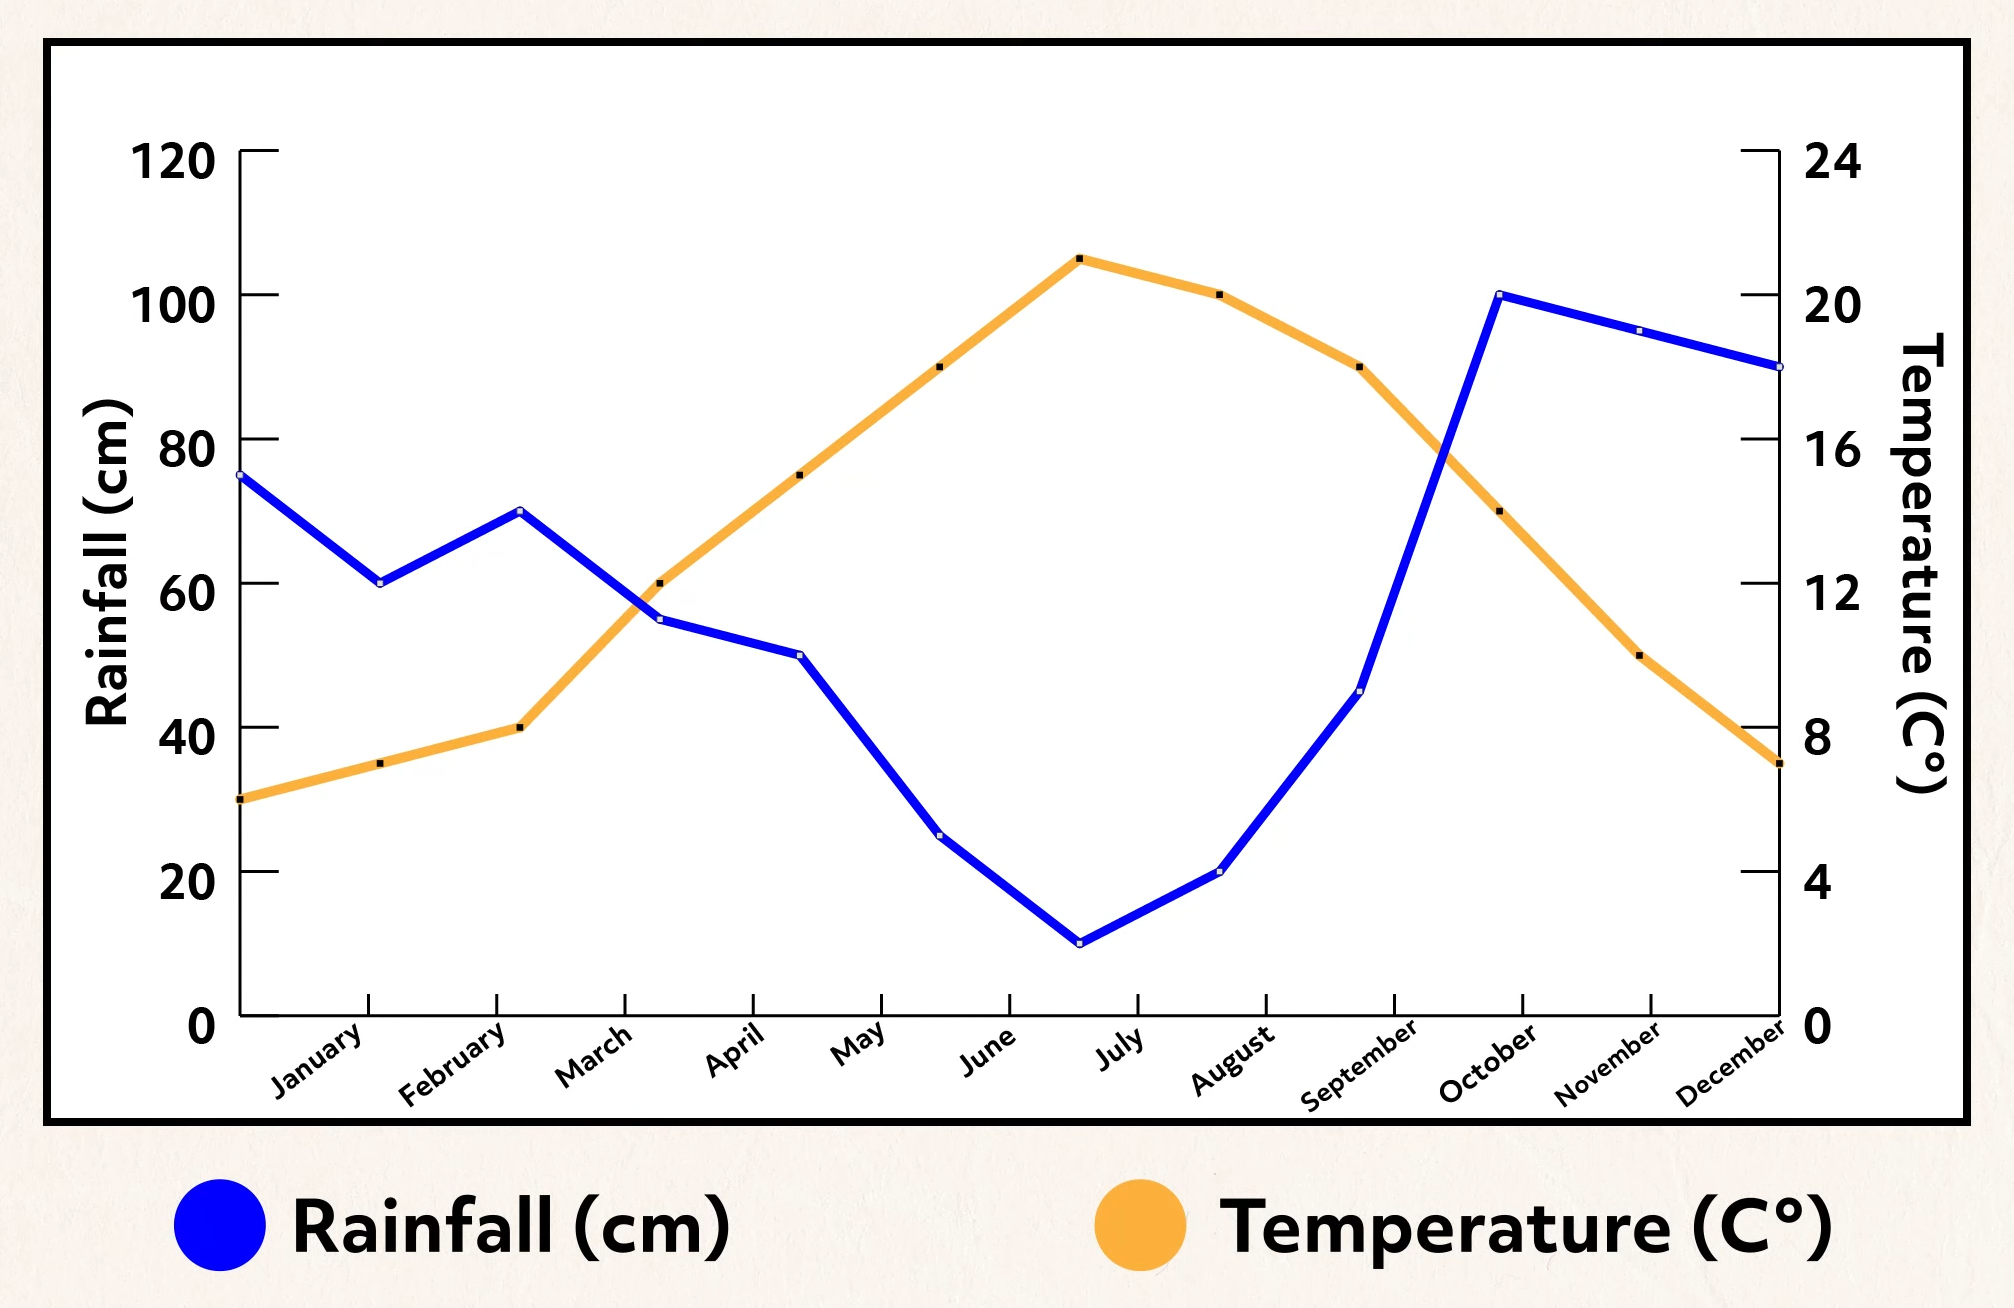
To read a point, first find its month along the bottom. Then follow the line of the quantity you want and read from that line’s scale. In July, the blue point shows about 10 cm of rainfall on the left. The orange point shows about 21 °C on the right. July has the lowest rainfall and the highest temperature shown on this graph. The highest rainfall is about 100 cm in October.
The two scales do not mean the same thing. A height aligned with 100 on the rainfall scale is aligned with 20 on the temperature scale. Never read the orange line using rainfall numbers, or compare the lines’ heights as though centimetres and degrees Celsius were the same measurement.
Look beyond single points as well. Rainfall generally falls between January and July, although it does not fall in every month. It then rises sharply towards October. Temperature rises towards July and falls afterwards. These are descriptions of the recorded pattern—not proof that a change in temperature caused a change in rainfall.
Turn a pattern into a sound conclusion
When interpreting any table or graph, use a short routine:
- Identify what is shown. Read the title or description, headings or axes, units, and any colour key.
- Find the values you need. In a table, match the row and column. On a chart, match the category or time to the correct numbered scale.
- Describe what the values support. Compare groups, identify a highest or lowest value, or describe a trend. Include a number when it strengthens your conclusion.
Be precise about the difference between observation and explanation. “The seedling count was highest in tray B” follows from the bar chart. “Tray B received more water” does not follow unless water amounts were also recorded. Similarly, a line rising over several months shows an increase in the measured value; it does not automatically explain the cause.
Key takeaways
Tables help you find exact results, bar charts help you compare distinct groups, and line graphs help you follow changes across ordered measurements such as time. In all three, labels, units, and scales come before conclusions. Support your interpretation with the values shown, and do not claim a cause that the data has not established.
This completes the scientific enquiry module. The next module begins with matter: you will use a particle model to explain how solids, liquids, and gases behave.