Welcome to the module on reliable cessation advice and treatment. Earlier in the course, you encountered nicotine dependence, learned why cues can keep cravings alive, and considered how withdrawal changes over time. Those ideas explain why quitting can be difficult. This module turns to a different issue: how to tell whether a proposed aid actually helps people quit.
In this lesson, you will assess a cessation claim by checking its source, its comparison group, and what it means by “success.” That approach is more dependable than accepting a compelling personal story or an impressive-looking percentage at face value.
Start with the source, then follow the evidence
A testimonial such as “I tried this method and never smoked again” may be entirely sincere. It tells you what happened to one person, but not how many others tried the same method without quitting, whether the person used additional support, or what would have happened without the method. A testimonial can suggest a coping idea; it cannot establish a treatment’s effectiveness.
The first check is the source presenting the claim. A professional-looking page is not, by itself, evidence of careful research. Look for an identifiable author or organization, an editorial or expert-review process, a date, links to the underlying research, and disclosure of funding or sales interests. A financial interest does not automatically make a finding false, but it gives you a reason to inspect how the evidence is presented.
MedlinePlus Evaluating Internet Health Information
Read MedlinePlus’s tutorial to see how an apparently credible health website can be assessed beyond its appearance.
On p. 5, read the source checklist, continuing through “Provider and Purpose—Part 1 of 6” on p. 6. Focus on who manages a site, who pays for it, and where its purpose is disclosed. Then, in “Information Quality—Parts 2–4 of 4” on pp. 19–22, read the evidence checks. This passage starts after the discussion of the site’s sponsor and ends just before the example showing a last-review date. Notice the difference between naming a study and giving readers enough detail to check it.
Even an accurate study can become a misleading headline when a summary selects only its most striking result. The following video introduces a useful habit: trace a claim back toward its original context rather than judging the headline alone.
Evaluating Sources & Fact Checking: Crash Course Scientific Thinking #6
Watch “Evaluating Sources & Fact Checking: Crash Course Scientific Thinking #6” from CrashCourse for its practical method of checking claims online.
Watch the SIFT method. Concentrate on investigating who published a claim, finding other reputable coverage, and tracing a striking statement back to the evidence behind it. The example is not about smoking; the checking method transfers directly to cessation claims.
A claim needs a fair comparison
Suppose someone says, “Most people I know who used this quit.” The missing piece is a comparison group: a group whose outcomes show what happened without that intervention, or with a different one. People who seek out a program may differ from people who do not in motivation, support, or smoking patterns. Simply comparing those two self-selected groups could mistake those differences for an effect of the program.
In a randomized controlled trial, participants are assigned by chance to intervention groups. Random assignment helps distribute pre-existing differences across groups, making an outcome difference more informative than a comparison between volunteers who chose different approaches. It does not guarantee that every group is identical or that a study is flawless.
Randomized control trial (RCT) explained
Watch “Randomized control trial (RCT) explained” from Henrik’s Lab for the basic reason researchers use random assignment.
Watch the group comparison. Focus on why the groups need to be comparable before treatment begins, and how random assignment helps make that possible.
The comparator must also be named. “Better results” means little without knowing better than what: usual care, no added intervention, a placebo, or another active form of help. Those comparisons answer different questions. An intervention might outperform usual care without outperforming another effective cessation aid.
Define success before interpreting a percentage
Quitting for a day, reporting no cigarettes during the past week, and remaining abstinent months later are different outcomes. For a claim about help with quitting, sustained abstinence measured after a substantial follow-up period is generally more informative than an early success story. Check when follow-up starts, how long it lasts, whether abstinence was self-reported or checked, and how the study handled people whose outcomes were missing.
A Cochrane overview shows these choices in practice. Use its methods as a model for evaluating evidence, rather than treating its treatment rankings as current, individualized prescribing advice: the reviews it summarizes were conducted between 2008 and 2012.
Medications to help people to stop smoking: an overview of reviews | Cochrane
Read the first “Methods” and “Results” passages in this Cochrane overview. They show what sits behind a claim that a treatment increases quitting.
Near the top of the page, start in “Methods” at the methods and results, ending with the final comparison in the adjoining “Results” paragraph. Attend to the randomized comparisons, outcomes measured at least six months from treatment start, and the explanation of results relative to placebo. The later technical statistics are not needed for this lesson.
Notice the wording “about 80% more people” in that overview. It describes a relative increase, not an increase of 80 percentage points. To see the distinction, imagine that 10 of every 100 people quit in a comparison group and 18 of every 100 quit with an intervention. That is eight additional people per 100, or 8 percentage points; it is also an 80% relative increase over 10. Both descriptions refer to the same hypothetical difference, but the absolute numbers make its scale easier to grasp.
The overview also draws on many randomized trials, not a single standout account. That does not mean every participant benefits or that a treatment is appropriate for everyone. It means the effectiveness claim is supported by repeated, defined comparisons with longer-term outcomes.
Read a cessation chart without accepting its headline for it
The chart below reports sustained smoking abstinence six months after a target quit date across several assigned intervention categories. The dark bars represent the intention-to-treat population, labeled ; the light bars represent an engaged cohort, labeled . These totals describe the two populations across the chart, not the size of each individual bar.
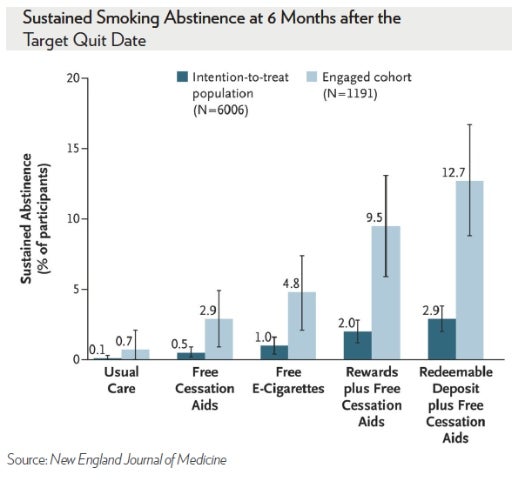
Take “rewards plus free cessation aids” as an example. Its dark bar is 2.0%, while its light bar is 9.5%. Quoting only “about 10% quit” would leave out a crucial condition: that figure is for the engaged cohort, not the entire intention-to-treat population. The chart does not explain how engagement was defined or how missing outcomes were handled. It would be unsafe to infer from these bars alone that becoming engaged caused the higher rate; people in the smaller cohort may differ from those outside it.
A comparison within the same labeled population is more meaningful than switching between dark and light bars. In the intention-to-treat population, the chart shows 0.1% for usual care and 2.0% for rewards plus free cessation aids: an absolute difference of 1.9 percentage points. That is more informative than announcing a dramatic multiple of the usual-care rate, which starts near zero. The error bars indicate uncertainty, but the image does not identify precisely what they represent. Nor does the image alone establish the trial’s full methods or whether any particular pairwise difference is statistically reliable.
The chart’s source line names a medical journal, which is a useful clue—not a substitute for its methods. The defensible reading is narrower than either “rewards guarantee success” or “the low percentages prove nothing works.” It reports sustained abstinence at a specified time, with different rates depending on both the intervention category and the population counted.
Put the checks together
For a cessation claim, use this compact sequence:
- Identify the source. Establish who published the claim, who funded or reviewed it, and whether the underlying research is identifiable.
- Find the comparator. Determine what the intervention was compared with and whether the groups were assigned fairly or selected themselves.
- Define the outcome. Look for sustained quitting, its follow-up period, and how abstinence and missing results were handled.
- Read the size of the effect. Prefer numbers for both groups and an absolute difference alongside any relative increase.
- Keep the conclusion within the evidence. An observed benefit is not a guarantee for an individual, and an engaged subgroup is not interchangeable with everyone assigned an intervention.
Applied to a post claiming that “rewards make 10% of smokers quit,” this sequence reveals an incomplete claim. The chart’s figure closest to 10% is 9.5% among the engaged cohort for rewards plus free cessation aids; its intention-to-treat figure is 2.0%. The post also leaves out the comparator and the limits of what the chart alone can establish. A careful response would describe the reported outcome and populations rather than repeating the headline.
Key takeaways
Reliable cessation advice rests on traceable sources, fair comparison groups, and clearly defined longer-term quitting outcomes. Personal accounts can be meaningful without proving that a method caused someone to quit. Percentages become useful only when you know who was counted, what they were compared with, and when success was measured.
The next lesson moves from judging claims to selecting behavioral support. The same evidence-minded approach will help distinguish what counseling, quitlines, groups, and digital tools can each offer.