Hello! In our previous lesson, we established a professional structure for our test suite by separating unit and integration tests and using markers for granular control. This organization is key to running efficient test cycles in a CI/CD environment. We've learned how to write good tests and how to run them selectively. Now, we'll tackle the final, crucial question in this module: how do we know our tests are comprehensive enough?
This lesson will guide you through generating and interpreting test coverage reports. You'll learn how to use pytest-cov, a powerful plugin for pytest, to measure exactly which lines of your application code are executed by your tests. We'll explore how to identify untested code paths and, most importantly, how to use this information to write better, more effective tests. For anyone working with data pipelines and CI/CD, understanding and utilizing code coverage is a non-negotiable skill for ensuring code quality and reliability.
What is Code Coverage (and What It Isn't)?
At its core, code coverage is a metric that tells you what percentage of your source code is "covered" or executed during your test suite run. It's a fantastic tool for finding gaps—parts of your application that your tests don't touch at all.
However, it's critical to understand the limitations of this metric from the outset. Many developers fall into the trap of chasing a 100% coverage score, believing it equates to a bug-free application. This is a dangerous misconception.
Code coverage vs. test coverage in Python - Honeybadger.io
This article from Honeybadger.io does an excellent job of debunking common myths associated with code coverage.
Please read the section titled Common misconceptions about coverage metrics. Pay special attention to "Misconception 1: 100% coverage means bug-free code." Understanding this distinction is the first step toward using coverage as a tool for insight, not as a misleading vanity metric.
The key takeaway is that coverage measures quantity, not quality. A test can execute a line of code (achieving coverage) but fail to properly assert that the code behaved correctly. Coverage tells you what you haven't tested; it doesn't guarantee that what you have tested is correct.
Generating Your First Coverage Report with pytest-cov
The standard tool for measuring coverage in a pytest environment is the pytest-cov plugin. It's a seamless integration that builds upon the robust coverage.py library.
First, you'll need to install it in your project's virtual environment:
pip install pytest-cov
Now, let's run it. A naive first attempt might be to just add the --cov flag.
pytest --cov
When you run this, you'll likely see a report that includes your test files themselves (e.g., tests/test_something.py). This inflates your coverage score because test files are, by definition, 100% executed when they run. This isn't what we want. We are only interested in the coverage of our application code.
The correct approach is to tell pytest-cov which source directory to measure. Assuming your project follows the modern src layout, you would run:
pytest --cov=src
The following video demonstrates this exact problem and its solution.
5 SIMPLE Pytest tricks to improve your tests
This clip from Carberra's "5 SIMPLE Pytest tricks" clearly shows why you must specify a source directory for accurate coverage reporting.
Watch from the introduction to coverage, where the initial command produces a misleadingly high percentage. Then, see how specifying the source with --cov=box (in his example) corrects the report to show the true application coverage.
After running the corrected command, you will see a clean report in your terminal.
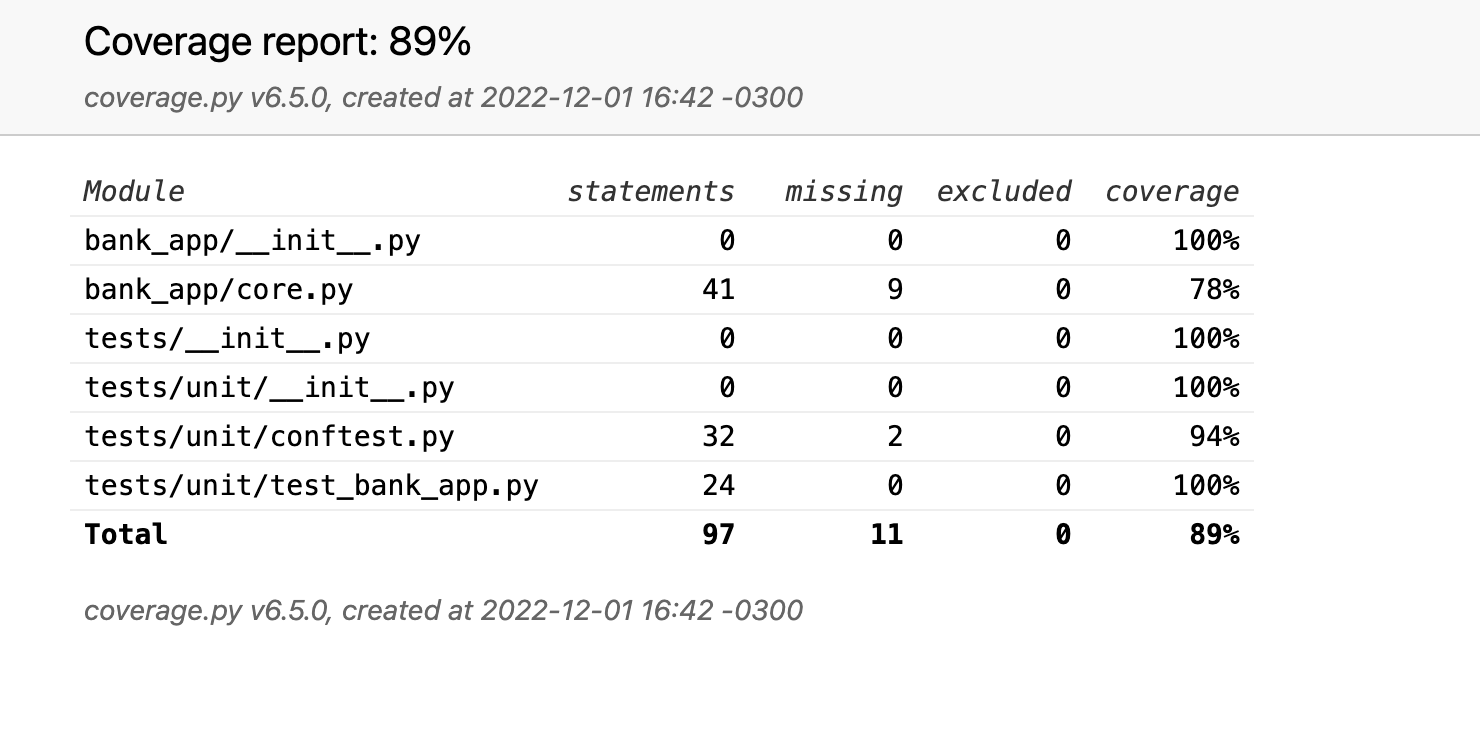
This report gives you a file-by-file breakdown:
- Stmts: The total number of executable statements in the module.
- Miss: The number of statements that were not executed during the test run.
- Cover: The coverage percentage (
(Stmts - Miss) / Stmts). - Missing: (Not shown in this image, but available with another flag) The specific line numbers that were not covered.
Identifying Untested Code Paths
The summary report is useful, but its real power comes from its ability to pinpoint exactly which lines of code are being missed.
Using term-missing
For a quick view directly in your terminal, you can add the --cov-report=term-missing flag.
pytest --cov=src --cov-report=term-missing
This will amend the report to include a Missing column, listing the line numbers or ranges of lines that were not executed.
5 SIMPLE Pytest tricks to improve your tests
The same video also shows how to use the term-missing report to find the exact lines you need to write tests for.
Watch the short segment from term-missing to see how the presenter uses the line numbers in the report to locate the untested remove_fruit function in his code.
This is an incredibly direct way to guide your testing efforts. If the report says Miss: 45-48, you know to go look at those lines in your file and figure out what condition or code path your tests didn't trigger.
The Interactive HTML Report
While term-missing is great for a quick check, the HTML report provides a much richer, interactive experience for exploring coverage. To generate it, run:
pytest --cov=src --cov-report=html
This command will create a new directory named htmlcov/ in your project root. Open the htmlcov/index.html file in your browser. You'll see a report similar to the terminal version but with clickable links for each file.

When you click on a file, you'll see your source code color-coded:
- Green: Lines that were executed by your tests.
- Red: Lines that were missed.
- Gray: Lines that were excluded (e.g., comments, or code explicitly marked to be ignored).
The following video gives a great tour of the HTML report.
This video from Gabriel Carneiro Jr provides a clear walkthrough of generating and interpreting the HTML coverage report.
Watch the segment from creating an HTML file. The presenter shows how to generate the report and then navigate into a specific file to see the green (covered) and red (missed) lines, making it obvious where new tests are needed.
From Report to Action: A Practical Workflow
Generating a report is easy. The real skill is using it effectively. Here's a professional workflow for improving your test suite using coverage reports:
- Write tests for the "happy path": Start by writing tests that cover the main, successful execution flow of your features.
- Generate a coverage report: Run
pytest --cov=src --cov-report=htmland open the report. - Hunt for red: Look for files with less-than-ideal coverage and click into them. The red lines are your to-do list.
- Analyze and test: For each block of red code, ask yourself:
- Is this an error condition I haven't tested? (e.g.,
pytest.raises(MyException)). - Is this a conditional branch (
if/else) that my tests never enter? - Is this code actually unreachable or "dead"? If so, maybe it should be removed.
- Is this an error condition I haven't tested? (e.g.,
- Write a new test that specifically targets one of these red blocks. Your goal is to write a test that makes a red line turn green.
- Rinse and repeat: Re-run the coverage report. The percentage should have gone up. Continue picking off the most critical untested branches one by one.
This iterative process transforms coverage from a passive score into an active guide for improving software quality.
Enforcing Coverage in CI/CD
Finally, to ensure your project maintains a high standard of testing over time, you can use coverage as an automated quality gate in your CI/CD pipeline. The --cov-fail-under=X flag will cause the pytest command to exit with an error code if the total coverage percentage falls below X.
# This command will pass only if total coverage is 80% or higher.
pytest --cov=src --cov-fail-under=80
This is extremely powerful. It prevents you or your team from accidentally merging code that reduces test coverage, thereby protecting the project's long-term health. The "right" number for X is debatable, but a value between 80% and 90% is a common and reasonable target for many projects.
Conclusion
In this lesson, you've completed your journey through the fundamentals of professional Python testing. You now know not only how to write, organize, and mock tests, but also how to measure their completeness and use that data to make your test suite truly robust.
Key Takeaways:
- Code coverage measures which lines of code are executed by tests, but it does not measure test quality.
- Use
pytest-covto generate coverage reports, and always specify your source directory (e.g.,--cov=src) for accurate results. - The
--cov-report=term-missingflag is excellent for a quick command-line view of untested lines. - The HTML report (
--cov-report=html) provides a rich, visual way to explore untested code paths. - Use coverage reports iteratively to guide you in writing new tests for error conditions and edge cases.
- Enforce a minimum coverage standard in your CI/CD pipeline with the
--cov-fail-under=Xflag to maintain code quality over time.
You have now mastered the core components of pytest. In our next module, we will shift our focus from testing code to organizing it. We'll dive into Poetry, a modern tool for managing project dependencies, creating reproducible environments, and packaging your Python applications for distribution.