Welcome back! In our first lesson, we established a high-level map of the Java Virtual Machine, identifying its main components: the Class Loader, Execution Engine, and the various Runtime Data Areas. Your goal is to move beyond simply using Java to truly understanding how it works, which is essential for acing tough technical interviews.
Today, we will zoom in on the heart of JVM's memory management. We'll dissect the three most critical memory regions you'll interact with as a developer: the Stack, the Heap, and the Metaspace. Understanding the distinct role of each, and how they interact, is fundamental to writing efficient code and diagnosing some of the most common and perplexing runtime errors. This lesson directly addresses the learning outcome of explaining the Java memory model by differentiating between these key areas.
The Stack: A Private Workspace for Each Thread
In our last lesson, we noted that some memory areas are shared across all threads, while others are private. The Stack is the primary example of a private memory area. Every time a new thread is started in your application, the JVM creates a dedicated stack for it. This isolation is what makes local variables inherently thread-safe.
The stack has a simple, yet powerful, purpose: it manages method execution. Let's explore its characteristics.
A Deep Dive into the JVM Memory Model
This article from the HeapHero blog provides a clear definition of the stack and its components. It will introduce you to the concept of a stack frame, which is central to understanding method calls.
Please read the section titled "2. The Stack". Focus on the description of what a stack is and the list of what each stack frame contains: local variables, an operand stack, and a reference to the runtime constant pool.
As the article describes, the stack works on a LIFO (Last-In, First-Out) principle.
- When a method is called, a new "frame" is pushed onto the top of the stack.
- This frame holds all the local variables for that method, including primitives (like
int,double) and, crucially, references (memory addresses) to objects. - When the method finishes, its frame is popped off the stack, and the memory it used is immediately reclaimed.
This rigid, orderly process is extremely fast. However, it has a fixed size. If you have a method that calls itself infinitely (a common bug known as infinite recursion), you will continuously push new frames onto the stack until it runs out of space. This results in the infamous java.lang.StackOverflowError.
The Heap: A Shared Home for All Objects
While the stack handles method execution and local variables, the Heap is where your data lives. It is a large, shared memory pool used by all threads in the application.
Any time you use the new keyword to create an object (e.g., new ArrayList(), new Customer()), the memory for that object is allocated from the Heap.
Java Memory Management: Understanding Heap, Stack, ...
This article from Java Code Geeks explains the role of the heap and introduces a concept we will explore later: generational garbage collection.
Read the two paragraphs that describe the Java Heap. Pay attention to the clear distinction: the heap houses object instances, not local variables. Note the mention of Young and Old Generations; this is a preview of how garbage collection works, which we'll cover in the next lesson.
The most important concept to grasp is the relationship between the Stack and the Heap. A local variable on the stack can be a reference to an object on the Heap. Think of it this way: the stack holds the "street address," while the heap is the "house" itself.
This diagram illustrates the relationship perfectly:
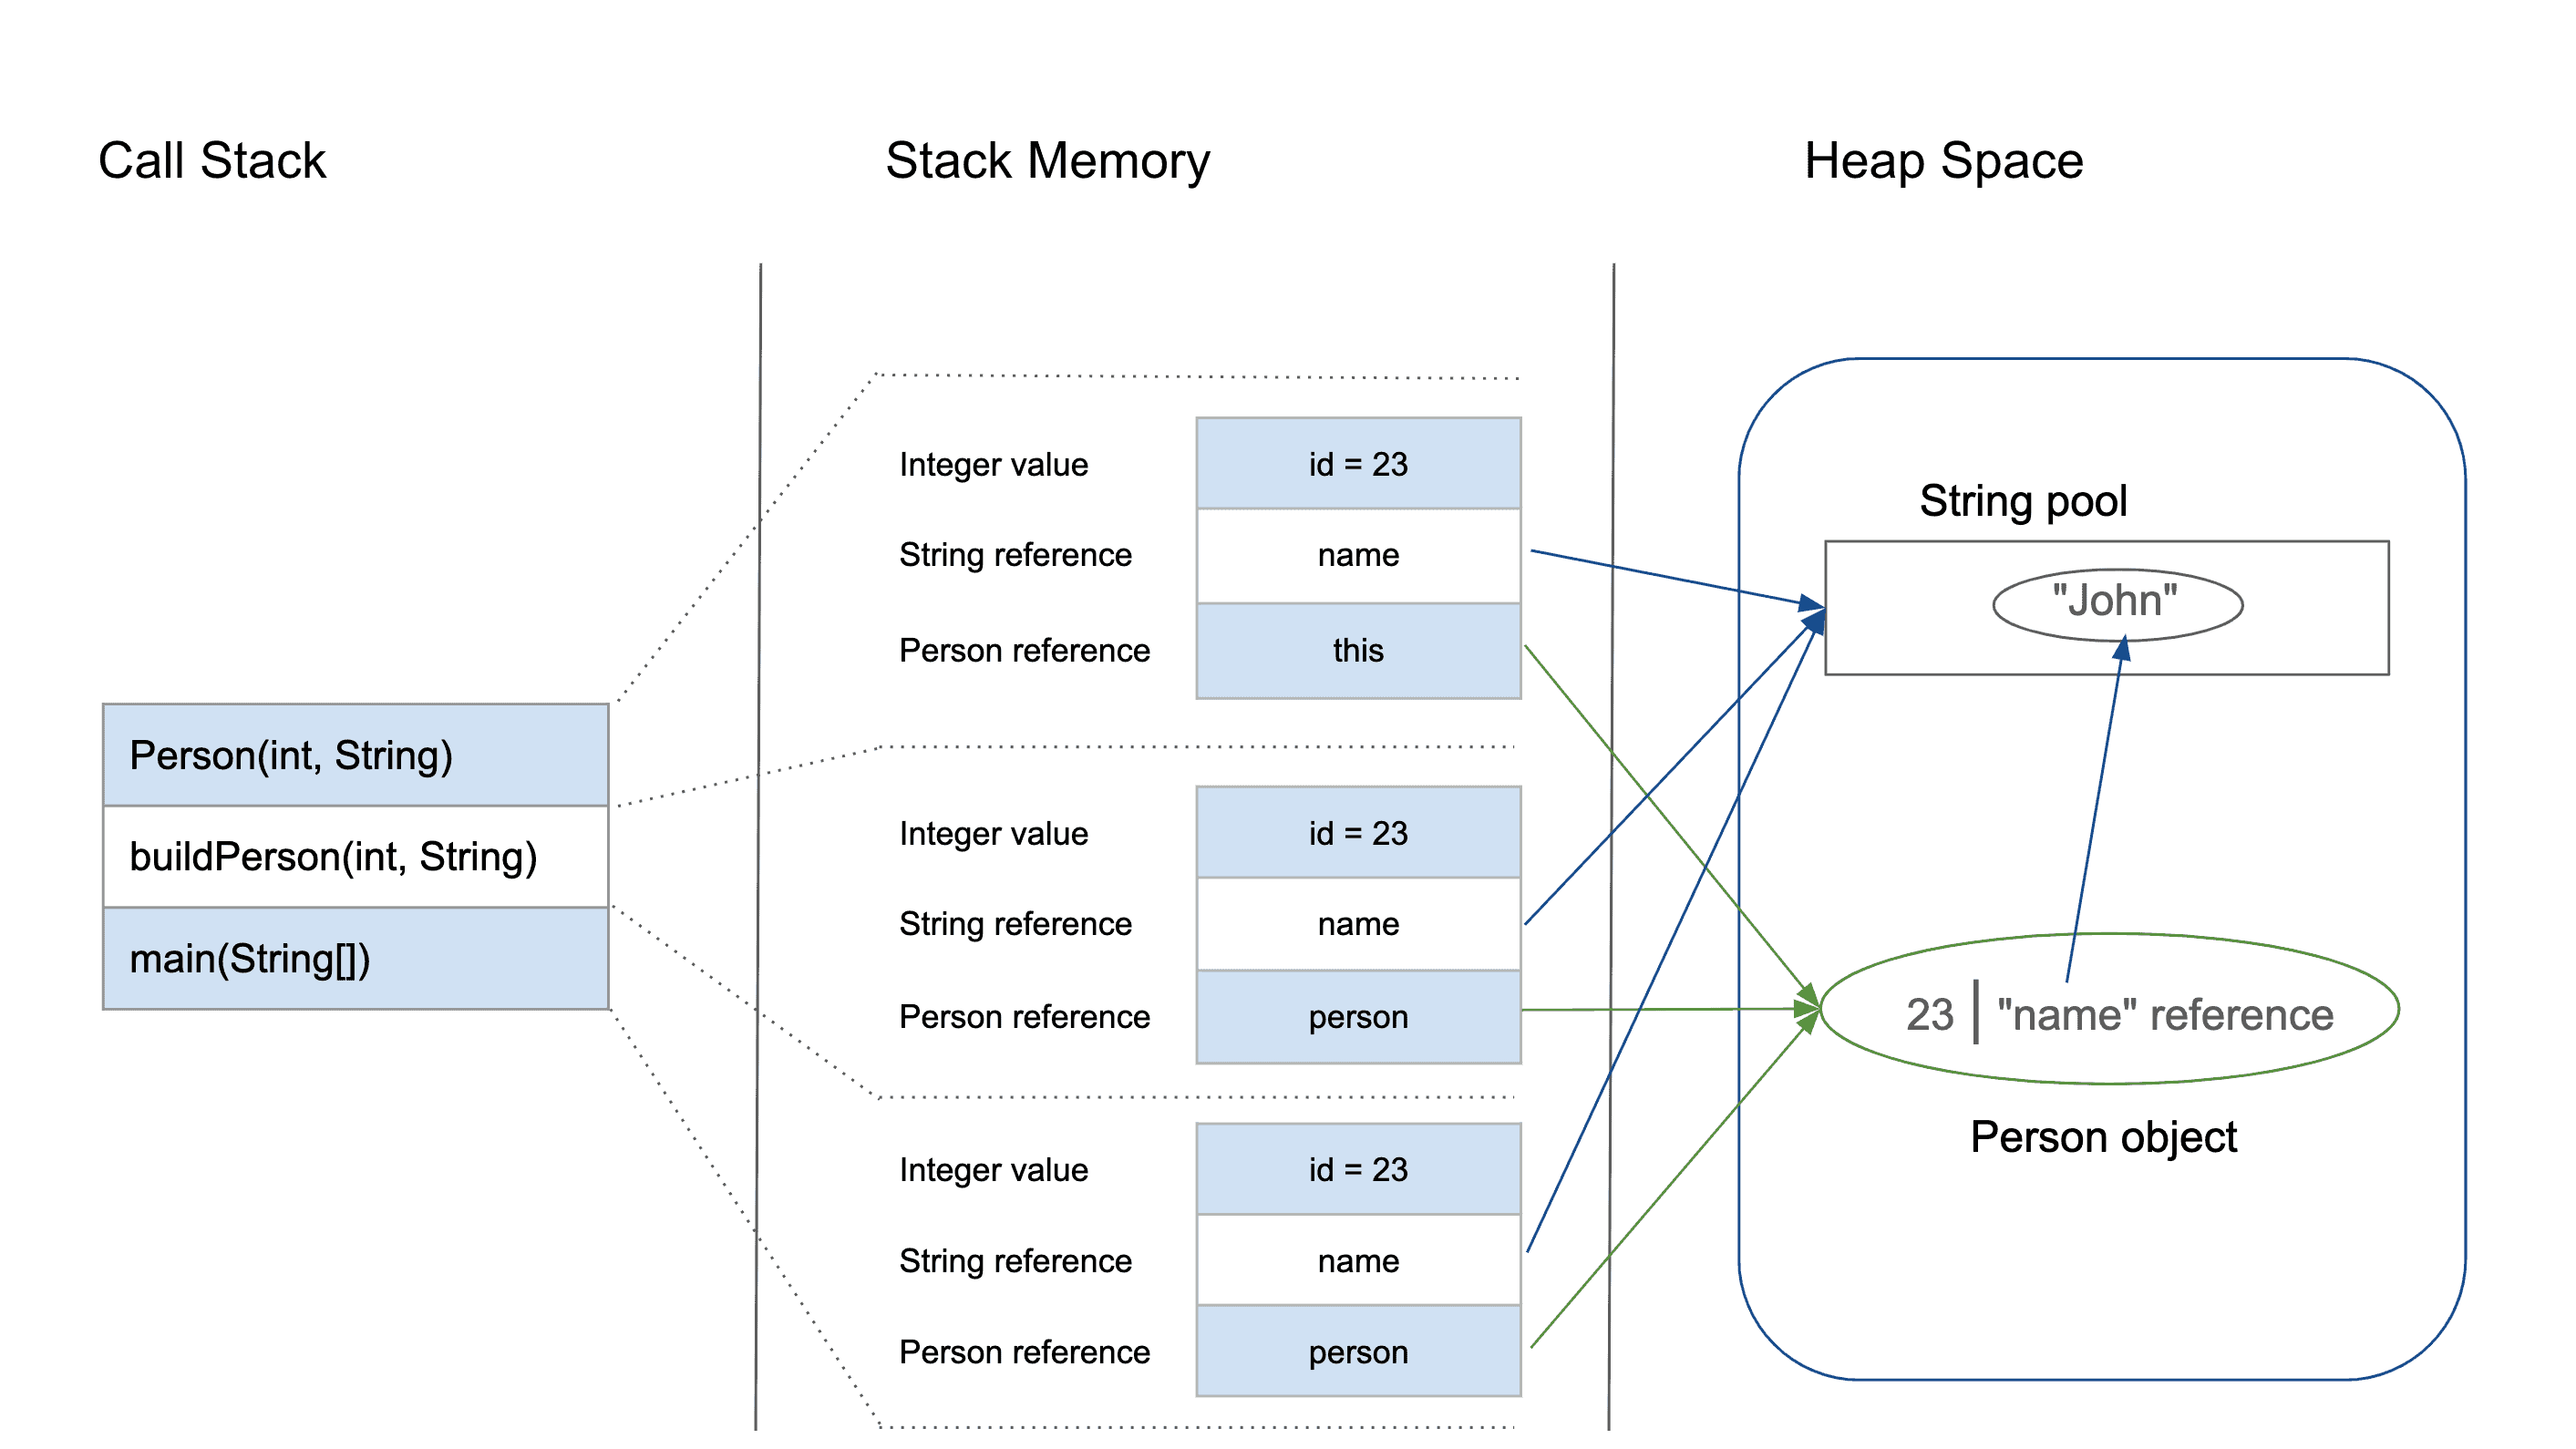
Because the Heap is a shared, finite resource, it can also be exhausted. If your application keeps creating objects and holding onto their references, preventing them from being cleaned up, you will eventually fill the heap. This leads to the equally infamous java.lang.OutOfMemoryError: Java heap space.
Visualizing Memory in Action
Definitions are useful, but seeing memory allocation in real-time provides a much deeper understanding. The following video walks through a simple Java program, showing exactly how the Stack and Heap are affected line by line. This is precisely the kind of mental model interviewers look for.
9. Java Memory Management and Garbage Collection in Depth
This video from the "Concept && Coding" channel provides an exceptionally clear, step-by-step visualization of Stack and Heap interactions during program execution.
Please watch the detailed walkthrough from the start of the example. The presenter methodically illustrates: How a stack frame is created for main. How primitive variables are stored directly in the stack frame. How new Person() allocates an object on the Heap and stores a reference in the stack frame. How a new method call pushes a new frame onto the stack. How method completion pops the frame, and its local references are destroyed. How objects on the Heap without any references become eligible for garbage collection. This segment is crucial for connecting the theoretical concepts to what actually happens when your code runs.
Metaspace: The Class Library
We've covered where method calls go (Stack) and where objects go (Heap). But where does the JVM store information about the classes themselves? This is the job of the Metaspace.
Metaspace is the area of memory where the JVM stores class definitions, method code, the runtime constant pool, and—importantly—static variables. Think of it as the JVM's internal library of blueprints for all the objects it might need to create.
For interview purposes, it's vital to know that Metaspace replaced an older area called the Permanent Generation (PermGen) in Java 8.

This change solved a major headache. PermGen had a fixed size, and applications that loaded many classes (common in application servers and frameworks you've likely used) would often crash with an OutOfMemoryError: PermGen space. Metaspace, by contrast, is allocated from the computer's native memory and can autogrow by default, making it far more flexible. However, it's not without its own problems.
A Deep Dive into the JVM Memory Model
This final section from the HeapHero blog explains Metaspace, its history with PermGen, and what can cause it to run out of memory.
Read the section titled "3. The Metaspace". Focus on what is stored in Metaspace and the causes of the java.lang.OutOfMemoryError: Metaspace, particularly the point about applications that dynamically generate classes.
Conclusion
In this lesson, we dissected the three most important regions of the JVM's memory. A solid grasp of their differences is non-negotiable for advanced Java development and interviews.
Here are the key takeaways summarized:
| Memory Area | Scope | Stores | Reclamation | Common Error |
|---|---|---|---|---|
| Stack | Per-Thread | Method frames, local primitive variables, and references to objects. | Automatic (when a method's frame is popped). | StackOverflowError |
| Heap | Shared (JVM) | All objects and arrays created with the new keyword. |
Automatic (by the Garbage Collector). | OutOfMemoryError: Java heap space |
| Metaspace | Shared (JVM) | Class metadata, method bytecode, and static variables. |
Automatic (when classes are unloaded by the GC). | OutOfMemoryError: Metaspace |
You now understand where different parts of your program live in memory and why certain types of errors occur. We saw that when references to objects on the Heap are lost, those objects become "unreferenced." But how does the JVM actually clean them up to reclaim that memory?
That is the job of the Garbage Collector, and it will be the subject of our next lesson. We will explore the fundamental process of how the GC finds and removes unused objects from the Heap.