In our previous lesson, we explored how to use the Kusto Query Language (KQL) to interactively search and analyze the rich telemetry data in Application Insights. This reactive approach is essential for diagnosing problems after they've occurred. Now, we'll shift our focus to proactive monitoring—detecting and responding to issues before your users report them.
This lesson concludes our module on monitoring by focusing on automation. We will build on your KQL knowledge to configure availability tests and alerts in Application Insights. You will learn how to set up automated "health checks" for your application's endpoints and configure Azure to notify you automatically when performance degrades or an outage occurs.
1. Proactive Monitoring with Availability Tests
The first step in proactive monitoring is to continuously check if your application is online and responsive. In Application Insights, this is accomplished through availability tests. These are automated tests that send web requests to your application from various locations around the globe at regular intervals.
There are different types of availability tests, but the most common is the Standard test (which has replaced the older "URL ping test"). It's a single-request test perfect for checking a public-facing endpoint like a web page or a health-check API.
The following video provides an excellent overview and demonstration of setting up these tests.
Alerts and Availability Testing :: Application Insights (6 of 6)
This video from Kevin Griffin's "Application Insights" series walks through the entire process of creating and interpreting availability tests. We'll watch it in segments.
First, get an understanding of what availability tests are and their purpose. Next, see how to configure a standard test. Pay attention to the key settings like test locations, frequency, and parsing dependent requests. Focus on the success criteria. This is where you define what a "successful" response looks like, such as an HTTP 200 status code or the presence of specific text in the response body. Finally, watch the practical demo of creating a test in the Azure portal and observing the results.
To complement the video, the official Microsoft documentation provides a detailed reference for all configuration options. It's a useful resource to have on hand when you're setting up your own tests.
Application Insights availability tests - Azure Monitor | Microsoft Learn
This document provides a comprehensive table of all the settings available when creating a Standard test.
Read the section titled "Create an availability test," focusing on the table that describes each setting under "Basic Information," "Standard test info," and "Success criteria." Compare these settings to what you saw in the video demo.
When a test runs, Application Insights checks if the endpoint is responding within the defined timeout and meets your success criteria. If it fails, Application Insights logs the failure, and you can drill down into the results to see why.
2. Configuring Alerts
Detecting a failure is useful, but the real power comes from being notified automatically. This is where alerts come in. An alert rule in Azure Monitor watches your telemetry data and triggers an action—like sending an email or an SMS—when a specific condition is met.
Alerting on Availability Test Failures
For availability tests, a common alert condition is "the test has failed from X out of Y locations." This prevents false alarms due to transient network issues in a single region.
You can access the alert configuration directly from the availability test menu.
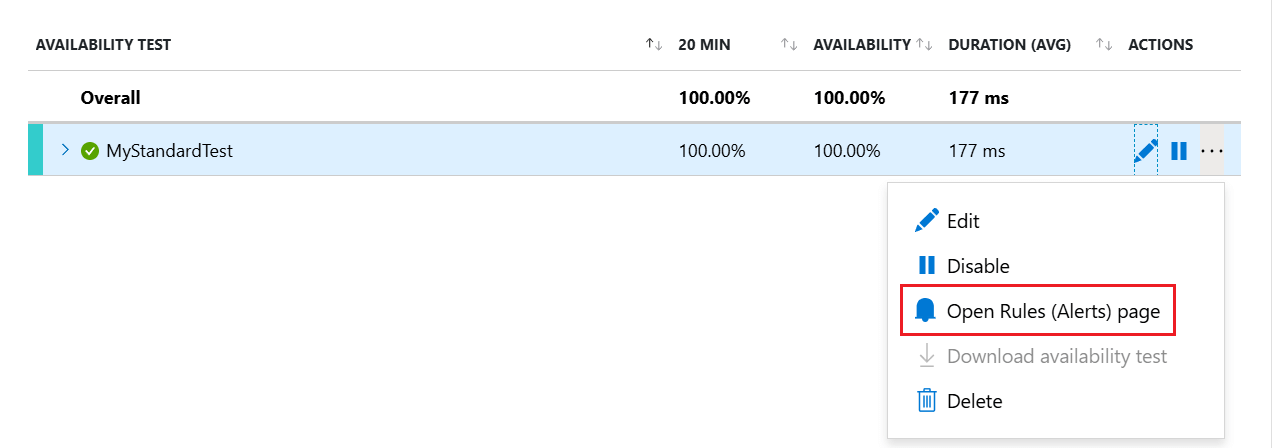
Once there, you define the logic for the alert.

Creating Custom Metric Alerts
While availability tests have built-in alert integration, you can also create more powerful and flexible alerts based on any metric tracked by Application Insights. This is where your KQL knowledge from the previous lesson becomes foundational. Alert rules can be based on the results of KQL queries or on predefined metrics.
The process involves three main steps:
- Scope: Define the resource to monitor (e.g., your Application Insights instance).
- Condition: Define the trigger. This is based on a signal, which can be a metric (like
Process CPU) or a log query result. You can use static thresholds (e.g., CPU > 80%) or dynamic thresholds that learn your application's normal behavior. - Actions: Define what happens when the alert fires. This is handled by an Action Group, which is a reusable collection of notifications (email, SMS, webhook, Azure Function call, etc.).
Let's return to the video to see a complete walkthrough of creating a custom metric alert.
Alerts and Availability Testing :: Application Insights (6 of 6)
The second half of the video is dedicated to creating custom alerts.
Start with the three steps for designing an alert: resource, condition, and action. Understand how to configure the alert condition, including selecting a signal and choosing between static and dynamic thresholds. Learn about Action Groups, which define the notifications and actions to be taken. Finally, watch the detailed end-to-end demo of creating a custom alert for CPU usage, configuring an email action group, and observing the alert as it fires and resolves.
3. Advanced Scenarios: Custom Availability Tests
Standard tests are great for public endpoints, but what if you need to test something more complex?
- A multi-step operation (e.g., log in, then access a resource).
- An endpoint in a private virtual network.
- An endpoint that requires a client certificate (mTLS).
For these scenarios, you can leverage your .NET skills to write custom availability tests. This involves creating a process (often an Azure Function on a timer) that runs your custom test logic and uses the Application Insights SDK's TrackAvailability() method to report the results.
This approach gives you complete control and flexibility. The following article provides a superb guide on how to implement this pattern using an Azure Function, which is highly relevant to your background.
Track Availability in Application Insights using .NET - Ronald Bosma
This blog post by Ronald Bosma details how to create custom availability tests using .NET and Azure Functions, overcoming the limitations of standard tests. It even provides a generic framework to simplify the process.
Read the Introduction and Solution Overview to understand the "why" and "what" of custom availability tests. Skim the section on Viewing Availability Test Results to see how these custom tests appear in the portal (they are marked with a CUSTOM label). Read the Setting Up Alerts section carefully. This is important because alerting for custom tests is different. Instead of linking to a web test resource, you create a metric alert that monitors the availabilityResults/availabilityPercentage metric and uses dimensions to filter for a specific test name.
This code-based approach is a powerful tool for a developer, allowing you to create sophisticated health checks that truly reflect the critical paths of your application.
Conclusion
In this final lesson of the module, we've moved from reactive diagnostics to proactive monitoring. You now have the tools to not only query for issues but to have Azure automatically detect them and notify you.
Key Takeaways:
- Availability tests proactively monitor your application's endpoints from multiple geographic locations.
- Standard tests are ideal for simple, single-request checks of public URLs.
- Custom
TrackAvailability()tests, often run via Azure Functions, provide the flexibility to test complex, multi-step, or private workflows using your C# skills. - Alerts are triggered when a condition (based on a metric or log signal) is met.
- Action Groups are reusable sets of notifications (email, SMS) and actions (webhook) that are executed when an alert fires.
- Alerts for standard tests are tied to the test resource, while alerts for custom tests are configured using metric alerts on the
availabilityResultsdata.
With this, you have completed the module on Monitoring and Troubleshooting! You are now equipped to instrument, analyze, and monitor your Azure solutions effectively.
Our next module will shift gears significantly. We will begin exploring Developing Containerized Applications on Azure. In the first lesson, we will lay the groundwork by covering fundamental Docker concepts and how to write a Dockerfile for a .NET application, preparing you to package and run your services in containers.