Recommended resources
The freely available resources this lesson will direct you to.
Introduction
In our previous lesson, we established a comprehensive blueprint for observability, detailing precisely what data to log across the computational, semantic, and agentic layers of your system. You now have a checklist for capturing the high-fidelity traces that are the source of truth for any production agent.
However, collecting data is a passive activity. A robust production system requires a proactive one: monitoring. This lesson is about turning that wealth of logged data into an active strategy for vigilance. Your learning outcome is to design a monitoring strategy using logged data to detect system failures and performance degradation.
We will move from simply having the data to ask questions (observability) to proactively asking the right questions at the right time to catch problems before they impact your clients (monitoring). We will explore a risk-based framework for prioritizing what to monitor, identify specific failure modes unique to agentic systems, and introduce advanced methods for diagnosing their root causes.
1. Beyond Traditional APM: Monitoring for Behavior
In traditional software systems, monitoring often focuses on a set of well-understood signals: CPU utilization, memory usage, API latency, and error rates (e.g., HTTP 5xx). These are still important, but for agentic systems, they are insufficient. An agent can be "healthy" by every traditional metric yet be stuck in a logic loop, drifting from its goal, or providing subtly incorrect information.
This requires a shift from monitoring just raw signals to monitoring behavior. The following video introduces this distinction and outlines the pillars of AI observability that form the foundation of a good monitoring strategy.
Rogue AI Agents: How AI Observability Builds Autonomous Trust
This video from IBM Technology succinctly explains why AI agents necessitate moving beyond traditional monitoring to a more holistic observability approach that includes decision tracing, behavioral monitoring, and outcome alignment.
Please watch the entire video. Pay close attention to the distinction made between 'monitoring' (raw signals like token count) and 'observability' (the contextual decision trail). This sets the stage for designing a strategy that looks at the 'why' behind an agent's actions, not just the 'what'.
As the video highlights, an effective strategy isn't just a dashboard of metrics; it's a system for replaying and analyzing an agent's entire decision-making process.
2. A Framework for Designing Your Monitoring Strategy
A monitoring strategy shouldn't be a random collection of alerts. It should be a deliberate, risk-based design. The Partnership on AI has developed a powerful framework for this, which we will adopt. It suggests that the intensity and nature of your monitoring should be calibrated based on three factors: Stakes, Reversibility, and Affordances.
Furthermore, failure detection isn't a single check but a set of layered controls applied at different stages of the agent's workflow.
[PDF] Prioritizing Real-Time Failure Detection in AI Agents
This paper from the Partnership on AI provides a formal framework for thinking about when and how to implement failure detection. It's a foundational text for designing robust agentic systems.
Please read two key sections that form the core of our design strategy: Start at the heading 'Failure detection is not a single function...' and read until the heading '...calibrated to the stakes of the use case...'. This section introduces the concept of layered controls (pre-action, during-action, multi-step). Next, read the section under the heading 'Failure detection efforts should be calibrated...' until the sub-heading 'High-stakes tasks or use cases...'. This section introduces the critical framework of Stakes, Reversibility, and Affordances. Focus on internalizing these two concepts: the layered model of where to monitor, and the risk-based model of how much to monitor.
To summarize this powerful framework:
- Layered Controls: Your strategy should include checks at multiple points:
- Pre-Action: Before the agent acts (e.g., validating user input, checking the planned steps).
- During-Action: As the agent executes a single step (e.g., monitoring a tool call for errors).
- Multi-Step: Across a sequence of actions (e.g., detecting if the agent is stuck in a loop or has drifted from the goal).
- Risk Calibration: You should invest more heavily in monitoring when:
- Stakes are High: The task involves finances, health, or legal liability.
- Actions are Irreversible: Deleting data, sending funds.
- Affordances are Unconstrained: The agent can dynamically select tools, access memory, and perform long, complex reasoning, making its behavior less predictable.
3. Detecting Key Failure Modes in Production
With our framework in place, let's identify the specific types of failures your monitoring strategy needs to detect. We can categorize them using the "layered controls" model. All of these rely on the detailed logs you learned to define in the previous lesson.
Pre-Action Monitoring
This layer acts as a gatekeeper before execution begins.
- Invalid/Malicious Inputs: Check for prompt injection attempts, requests for harmful content, or PII in user queries. Your "Safety" logs from the last lesson are the data source here.
During-Action Monitoring (Single-Step Failures)
This layer monitors the health of individual steps in the trace.
- Performance Degradation:
- Metric: Latency per span (LLM call, tool call, retrieval).
- Detection: Set thresholds for acceptable latency. Alert if p95 latency for a specific tool call or model response exceeds the threshold over a time window.
- Cost Spikes:
- Metric: Token count per trace.
- Detection: Alert if the average token count for a specific type of task suddenly increases, indicating a potential issue with prompt construction or model verbosity.
- Tool Call Failures:
- Metric: Tool call status from your agentic logs.
- Detection: Trigger an immediate alert on high rates of non-transient API errors (e.g.,
401 Unauthorized,400 Bad Request) from a critical tool.
Multi-Step Monitoring (Behavioral Failures)
This is the most complex and critical layer for agentic systems, detecting issues that only emerge over a sequence of actions. Traces are essential here.
- Logic Loops: The agent gets stuck repeating the same or similar steps.
- Detection: Monitor traces for repeated sequences of tool calls with similar arguments. For example, if the agent calls
update_file('a.py')five times in a row, flag the trace for review.
- Detection: Monitor traces for repeated sequences of tool calls with similar arguments. For example, if the agent calls
- Goal Drift: The agent's actions are no longer aligned with the original user request.
- Detection: This is harder and often requires another LLM. A "monitor agent" can periodically compare the latest agent action/plan against the initial user prompt and flag semantic deviations.
- Quality Degradation: The agent's final output quality drops over time.
- Detection: Monitor user feedback scores (explicit thumbs up/down) or run automated LLM-based evaluators (checking for hallucination, relevance) on a sample of production traces. A dip in the average quality score is a clear signal of performance degradation.
The following video demonstrates how observability platforms like Langsmith are used to find these behavioral "pathologies" in traces and how that data informs improvements.
Building Better AI Agents: Observability and Evaluation
This video from LangChain shows a practical workflow for using traces to identify and fix agent failure modes. It brings the concept of monitoring behavioral failures to life.
Please watch from 09:06 to 32:13. This is a deep dive, so focus on the concepts, not the specific code: Types of Evaluation (09:06 - 15:40): Understand how evaluation is broken down into single-step, full-turn, and multi-turn tests, which mirrors our layered monitoring approach. How Traces Power Evaluation (15:40 - 21:41): Note how production traces are used to build datasets for offline evaluation and to power online monitoring for issues like looping or unusual tool patterns. Practical Walkthrough (21:51 - 32:13): Observe how the presenter analyzes traces to understand agent behavior, looks for specific pathologies (like an agent editing a file repeatedly), and uses this analysis to generate reports and improve the agent harness. This is a real-world example of a monitoring strategy in action.
4. Advanced Diagnosis: Causal Analysis for Root Cause Identification
Detecting a failure is the first step. For complex, multi-agent systems, the second, harder step is diagnosing the root cause. Did Agent C fail because its logic is flawed, or because its input from Agent B was corrupted, which in turn was caused by a poor retrieval from Agent A?
Simple correlation is not enough. Given your background, you can appreciate the need for a more formal approach. Causal analysis provides a mathematical framework for moving beyond "what failed" to "why it failed." It involves modeling your agentic workflow as a causal graph and using the rich data from your observability logs to identify the true source of an error.
Explaining Failures in LLM-Based Agentic Systems: A Causal ...
This article provides a superb, high-level introduction to applying causal analysis to LLM-based agentic systems. It connects the observability data we've been discussing to a formal method for root cause analysis.
Read the following sections to grasp the core concepts: Abstract, Complexity of Agentic Workflows..., and Why Root Cause Analysis Matters: These sections set the stage, explaining why complex agent interactions demand more than simple debugging. Observability and Evaluation and Causal Foundations...: This is the key part. It explicitly links the observability tools and data we've discussed to the principles of causal inference, explaining why observation alone isn't enough and mentioning formalisms like do-calculus. Conclusion: This summarizes the benefits of the approach. You don't need to master the formulas, but focus on the conceptual shift from correlation to causation.
Incorporating causal analysis into your monitoring strategy means designing your system to not only log traces but also to provide the necessary data for building and analyzing a causal model of your workflow. This is a state-of-the-art approach that provides the "evidence, not vibes" you're looking for.
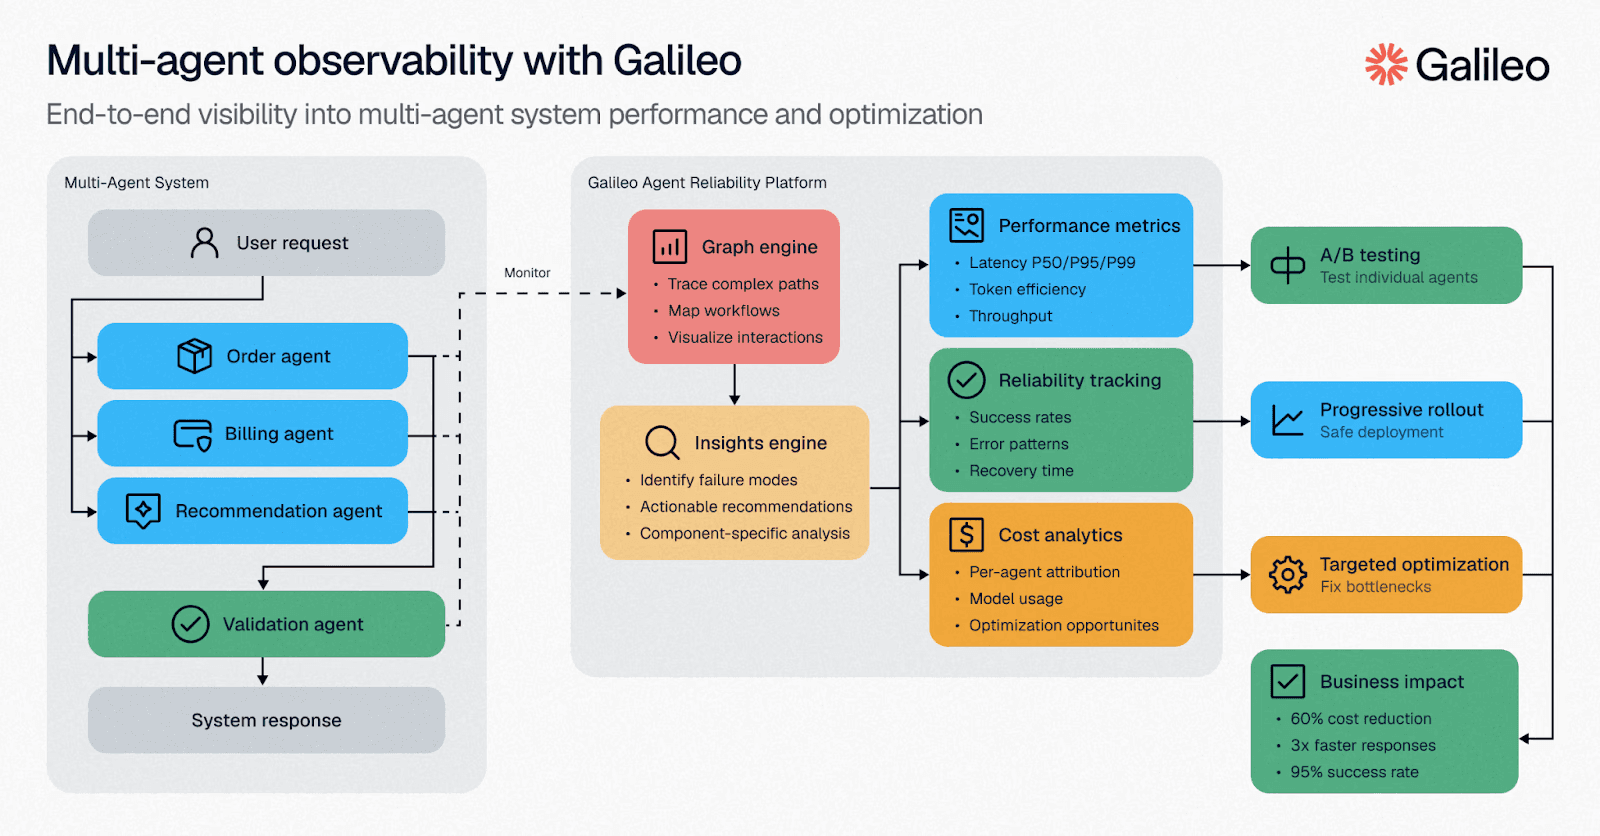
5. Visualizing the Strategy
Finally, let's visualize how these components fit together. An effective monitoring strategy culminates in a system that ingests observability data, performs analysis, and presents actionable insights.

Conclusion
In this lesson, you have designed a multi-faceted monitoring strategy that goes far beyond simple health checks. You've learned to think about monitoring in a structured, risk-based way, preparing you to build and manage reliable, production-grade agentic services.
Key Takeaways:
- Monitoring is a Proactive Strategy: It uses the data collected by your observability framework to actively detect failures and performance degradation.
- Design is Risk-Based and Layered: A robust strategy calibrates its intensity based on stakes, reversibility, and agent affordances, and it applies controls at the pre-action, during-action, and multi-step stages.
- Focus on Behavioral Failures: The most critical and unique failures in agentic systems are behavioral (e.g., looping, goal drift). Your strategy must be designed to detect these using detailed trace analysis.
- Move from Detection to Diagnosis: For complex systems, supplement simple alerts with advanced techniques like causal analysis to identify the true root cause of failures, enabling more effective and lasting fixes.
You now know how to log the right data and how to build a strategy to act on it. In our next lesson, we will focus on a critical aspect of this data: cost. We will learn how to estimate token usage and API costs for a given agentic workflow based on its design and expected usage patterns, a crucial skill for pricing your services and managing profitability.