Introduction
In our previous lesson, we established how Singular Value Decomposition (SVD) provides an optimal method for dimensionality reduction through truncation. We saw that by keeping only the first singular values and their corresponding vectors, we can construct the best possible rank- approximation of a matrix, . While the theory is powerful, its true value becomes apparent when we see it in action.
Today, we'll ground these abstract concepts in concrete, real-world applications. This lesson will equip you with two memorable and compelling examples to use in your interview: image compression and recommender systems. By understanding how SVD solves these practical problems, you'll be able to provide a rich and insightful answer that demonstrates a deep conceptual grasp of its utility. This lesson concludes our module on linear algebra, bridging the gap between theory and application just before we move on to calculus.
Application 1: Image Compression
One of the most intuitive applications of truncated SVD is image compression. The core idea is simple: a digital image is fundamentally a matrix of numbers. For a grayscale image, this is a single matrix where each entry represents the brightness of a pixel. For a color image, you can think of it as three separate matrices for the red, green, and blue channels.
Let's focus on a grayscale image. This image is a matrix . If we apply the truncated SVD process from our last lesson, we get a rank- approximation, .
- A small value of means we are using very few singular values. This results in a highly compressed image that requires storing only a few vectors from and . The trade-off is that the reconstructed image will be coarse and blocky, losing fine details.
- As we increase , we add more terms from the SVD expansion (), each adding a layer of detail. The image quality improves, but the compression ratio decreases.
The image below beautifully illustrates this trade-off.
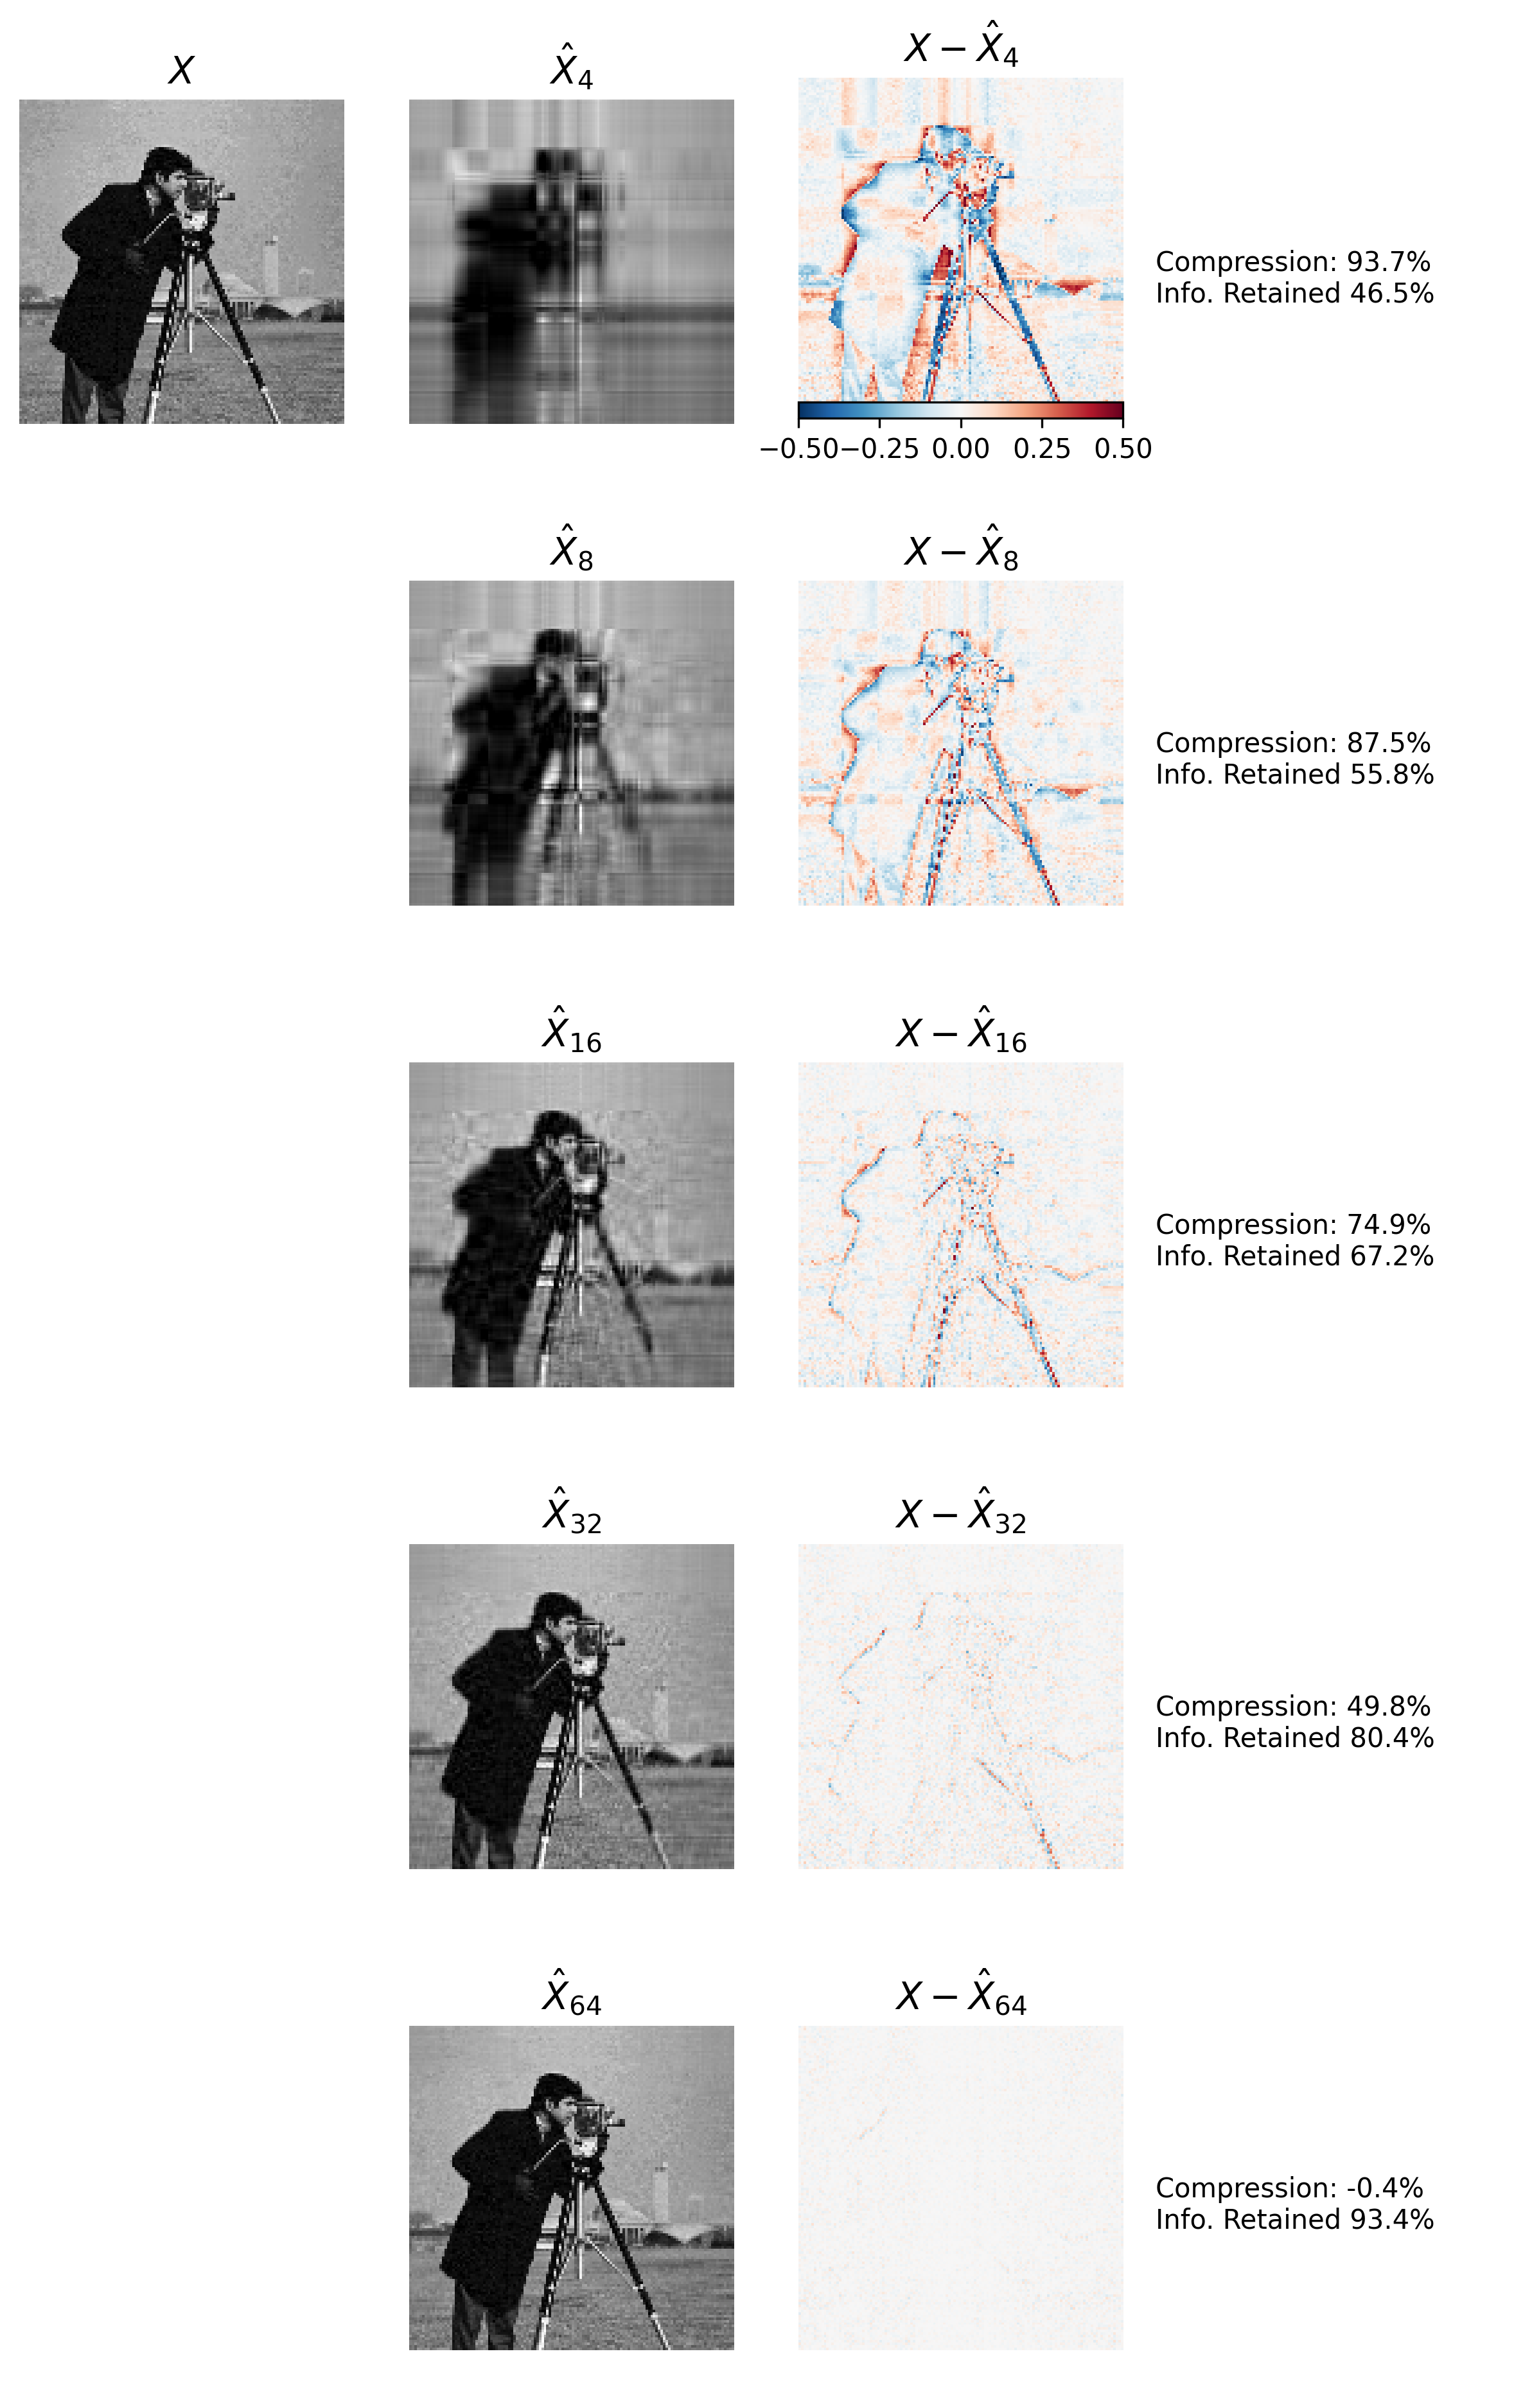
Notice how with just or singular values, we get a recognizable approximation of the original image, even though we've discarded a significant amount of information. This demonstrates the power of SVD in identifying and preserving the most "important" structural features of the data.
To see this process in action, the following video by Steve Brunton provides an excellent demonstration using Python. It reinforces the concepts of rank-k approximation and visualizes how the singular values capture the "energy" of the image.
SVD: Image Compression [Python]
The video "SVD: Image Compression" from Steve Brunton's channel walks through the entire process.
First, watch the introduction where he frames the problem: the basic idea. Next, skip to the core of the demonstration where he computes the SVD and plots the reconstructions for different ranks: the SVD part. Observe how the image quality of his dog "Mort" improves as the rank increases from 5 to 100. Finally, focus on his analysis of the singular values: plotting the values. The steep drop in the singular values plot shows that the first few values capture most of the image's "energy," which is precisely why the low-rank approximation works so well.
This application is a direct, visual confirmation of the Eckart-Young theorem we discussed: truncated SVD gives you the best possible visual approximation for a given level of compression.
Application 2: Recommender Systems
A second, and perhaps even more impactful, application of SVD is in building recommender systems, famously demonstrated during the Netflix Prize competition.
The setup is as follows: imagine a huge matrix where the rows represent every Netflix user and the columns represent every movie in the catalog. The entries in this matrix are the ratings users have given to movies. This matrix is enormous and, crucially, extremely sparse, since most users have only rated a tiny fraction of the available movies. The goal of a recommender system is to predict the missing entries—to predict how a user would rate a movie they haven't seen.
This is where SVD comes in, though with a twist. The idea is to use matrix factorization to uncover latent features (or "hidden tastes") that explain the observed ratings.
- The decomposition can be conceptually understood as breaking the user-item rating matrix into two smaller, denser matrices.
- The matrix of left singular vectors, , can be thought of as a user-feature matrix. Each row describes a user in terms of their affinity for a set of latent features (e.g., how much they like "dark comedies," "action movies with a strong female lead," or "90s sci-fi").
- The matrix of right singular vectors, , can be seen as a movie-feature matrix. Each column describes a movie in terms of how much it possesses these same latent features.
To predict a rating for a specific user and movie, you simply take the dot product of that user's feature vector and that movie's feature vector. This is visualized in the diagram below.

The following reading provides an excellent overview of how this was applied in the context of the Netflix Prize.
The Netflix Prize and Singular Value Decomposition | Data Mining
This document from a course at Rutgers University explains the SVD-based solution to the Netflix recommendation problem.
Focus on the section titled SVD Solution. Pay close attention to the interpretation of the factored matrices as containing "inter-user" and "inter-item" factors, and how their product, \hat{r}_{ui}= q_i^T p_u, generates the rating prediction.
A Crucial Nuance: Handling Missing Data
There's a critical real-world detail here that will make your interview answer particularly sharp. Standard SVD algorithms require a complete matrix with no missing values. But the user-item rating matrix is almost entirely missing values!
Therefore, practical recommender systems don't use "pure" SVD. Instead, they use SVD-inspired iterative algorithms (like Stochastic Gradient Descent or Alternating Least Squares) that can learn the user-feature and movie-feature matrices directly from the sparse, incomplete data.
The following video explains this distinction clearly.
Using Singular Value Decomposition (SVD) for Movie Recommendations
Frank Kane's video "Using Singular Value Decomposition (SVD) for Movie Recommendations" provides a great high-level explanation.
Watch the segment from the key insight. He explains exactly why pure SVD fails and how algorithms like SGD are used to "learn" the factor matrices instead of computing them directly. Mentioning this shows a deeper, more practical understanding of the topic.
Crafting Your Interview Answer
Let's synthesize this into two powerful, concise answers for your interview.
Question: "Can you provide a real-world example of SVD?"
Answer Option 1 (Image Compression):
"A great example is image compression. You can represent a grayscale image as a matrix of pixel values. By performing SVD on this matrix, you get three new matrices: , , and . The singular values in , which are sorted by importance, tell you which components contribute most to the image's structure.
For compression, you perform a 'truncated SVD.' You keep only the top, say, 50 singular values and their corresponding vectors, and discard the rest. By multiplying these smaller, truncated matrices back together, you get a rank-50 approximation of the original image. This approximation is the best possible for that rank, capturing the most important visual features while using significantly less data to store."
Answer Option 2 (Recommender Systems):
"A classic example is in recommender systems, like the ones used by Netflix. You can imagine a massive matrix with users as rows and movies as columns, containing user ratings. The challenge is to predict the missing ratings.
SVD helps by factoring this large matrix into smaller 'latent feature' matrices: one describing user tastes and another describing movie characteristics. For example, a latent feature might correspond to a genre like 'sci-fi' or a more abstract concept like 'quirky comedies.'
The dot product of a user's 'taste' vector and a movie's 'characteristic' vector gives a predicted rating. A key detail is that since the original ratings matrix is mostly empty, you can't use standard SVD. Instead, algorithms inspired by SVD, like Alternating Least Squares, are used to learn these feature matrices from the sparse data that is available."
Conclusion
You have now completed the linear algebra module for your interview preparation. We have moved from the fundamental building blocks of matrices and vectors to the geometric intuition of eigenvalues, and finally to the powerful, practical applications of SVD. You are now equipped to explain not just what SVD is () and how it's used for dimensionality reduction (truncation), but also where it makes a real-world impact.
Key Takeaways:
- Image Compression: SVD decomposes an image matrix, allowing for a low-rank approximation that preserves key visual features while reducing storage size. The number of singular values kept () controls the trade-off between quality and compression.
- Recommender Systems: SVD-inspired methods are used to factor a sparse user-item rating matrix into dense user-feature and item-feature matrices. This uncovers latent tastes and allows for the prediction of missing ratings.
- Practicality is Key: Knowing the nuance that standard SVD doesn't work for incomplete data (as in recommender systems) demonstrates a deeper level of understanding.
In our next lesson, we will pivot to the second major pillar of AI's mathematical foundations: Calculus & Optimization. We will start by refreshing your knowledge of computing derivatives, which are the fundamental tools for finding how functions change—a concept at the very heart of machine learning.