Introduction
In our last lesson, we explored the powerful C pattern of using pointer parameters to allow a function to "return" multiple values. We saw theoretically how a function could receive the memory address of a variable from its caller and write a result directly to that location. Today, we bridge the gap between theory and practice. You will learn to use the GNU Debugger (GDB), the quintessential tool for C programmers, to make these abstract memory operations visible and tangible.
This lesson is designed to give you a foundational skill that will serve you throughout your entire programming journey. We'll start with the essential GDB commands in the terminal to build a solid understanding of what's happening under the hood. Then, we will integrate this knowledge into your preferred Visual Studio Code environment, turning abstract commands into a fluid, visual debugging workflow. By the end of this session, you'll be able to step through your code, inspect memory addresses, and watch pointer values change in real-time.
Compiling for Debugging: The -g Flag
Before we can debug a program, we must first tell the compiler to include extra information that a debugger can use. This "debug information" maps the compiled machine code back to your original source code, including line numbers, variable names, and data types. Without it, the debugger can only show you a sequence of processor instructions, which is far from ideal.
To include this information, we use the -g flag when compiling with GCC.
gcc -g -Wall -o my_program my_program.c
The following video from the Low Level channel clearly explains why this step is non-negotiable for effective debugging.
GDB is REALLY easy! Find Bugs in Your Code with Only A Few Commands
This video succinctly demonstrates the difference between a program compiled with and without debug symbols.
Watch the segment from the beginning until the end of the section. Notice how GDB is unable to show the source code for a "stripped" executable but can easily do so for one compiled with the -g flag.
The Core Debugging Workflow
Debugging with GDB follows a standard cycle, whether you're using the command line or a graphical interface.
- Set Breakpoints: A breakpoint is a deliberate stop sign you place in your code. When the program's execution reaches a breakpoint, it pauses, and GDB gives you back control.
- Run the Program: You start the program under GDB's supervision. It will run at full speed until it hits a breakpoint, encounters an error, or finishes.
- Inspect State: Once paused, you can examine the call stack, inspect the values of variables, and even look at raw memory contents. This is the "investigation" phase.
- Control Execution: From the paused state, you can choose to continue running to the next breakpoint, or step through your code line by line to observe its behavior in fine detail.
Let's explore the fundamental commands for this workflow.
Controlling Program Flow
First, you launch GDB by passing your compiled executable as an argument:gdb ./my_program
This starts GDB but doesn't run your program yet. You'll see a (gdb) prompt, waiting for your commands.
Breakpoints and Running
Your first step is usually to set a breakpoint at a logical starting point, like the main function.
(gdb) break main
(You can use the shorthand b main)
Now, you can run the program.(gdb) run
(Shorthand: r)
The program will start and immediately stop at the first line of main.
Stepping Through Code
Once paused, you have two primary ways to move through the code:
next(orn): Executes the current line and stops at the next line in the current function. If the current line is a function call,nextexecutes the entire function without stopping inside it (it "steps over").step(ors): Executes the current line. If the line is a function call, the debugger will stop at the first line inside that function (it "steps into").
The distinction is critical. Use next when you trust a function and just want its result. Use step when you want to investigate what happens inside a function.
This video demonstrates these commands in action.
GDB is REALLY easy! Find Bugs in Your Code with Only A Few Commands
The presenter demonstrates setting a breakpoint and using next and step to navigate the code.
Watch the section on setting a breakpoint at main and running the program. Then, continue through the explanation of next, nexti, and step from this segment. Pay close attention to the conceptual difference between stepping "over" versus stepping "into" a function call.
Inspecting Memory and Pointers
This is where we connect today's lesson to the previous one. When your program is paused, GDB provides powerful commands to inspect its state.
The print Command
The print command (shorthand: p) evaluates an expression in the context of the current program state and displays the result.
Let's use the calculateAttack function from our last lesson. Assume we've set a breakpoint inside it and the program is paused.
p finalDamage: This prints the value of the pointerfinalDamageitself, which is a memory address. It will look something like0x7fffffffe1a4.p *finalDamage: This dereferences the pointer and prints the value stored at that memory address. This is how you see the integer value that the pointer is pointing to.p &baseDamage: This prints the memory address of a local variable. Comparing this to the address held infinalDamagecan help you visualize how these variables are located in different parts of memory (specifically, different stack frames).
The examine Command
While print is great for variables, the examine command (shorthand: x) lets you look at raw memory, independent of data types. Its syntax is x/<n><f><u> <address>, where:
n: How many units to display.f: The format (e.g.,xfor hexadecimal,dfor decimal).u: The unit size (e.g.,bfor byte,wfor 4-byte word).
For example, if finalDamage holds the address 0x7fffffffe1a4:
(gdb) x/1wx 0x7fffffffe1a4
This command says: "Examine (x) 1 (/1) word (w) in hexadecimal (x) at the address 0x7fffffffe1a4." This allows you to see the raw bytes that make up the integer value, which is exactly how the computer sees it.

Let's solidify these concepts with a comprehensive reading.
This guide from Stanford University's CS107 course is an excellent reference for core GDB commands.
Please read the following sections: Start with Running gdb and Breakpoints for a recap on setup. Read Controlling Execution to reinforce your understanding of next and step. Focus carefully on the section The print command to see how to inspect variables. Finally, read the crucial section Examining Memory, which introduces the x command for viewing raw memory.
From Command Line to VS Code
Now that you understand the fundamental GDB commands, we can map them to the graphical interface in VS Code. The VS Code debugger is a front-end that uses GDB behind the scenes. Every button you click is sending a command like next or print to a hidden GDB process.
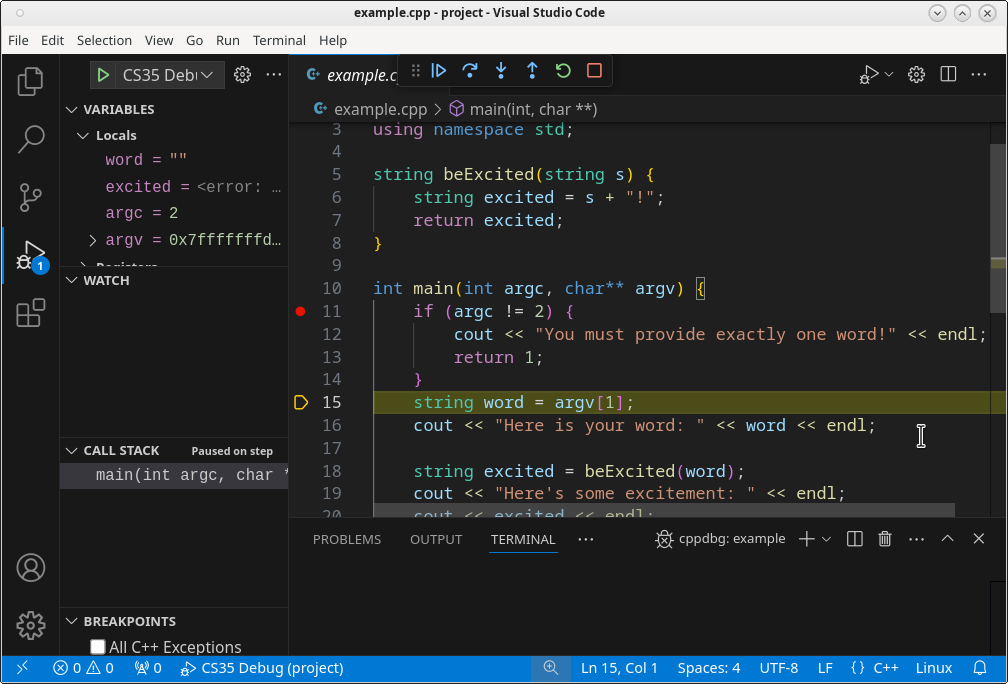
- Breakpoints: Click in the gutter to the left of the line numbers. A red dot will appear.
- Run and Debug: Use the "Run and Debug" panel (the bug icon on the left sidebar) and press the green play button.
- Control Toolbar: A floating toolbar will appear with buttons for
continue(play),step over(next),step into(step),step out, andrestart. - State Inspection: The "Variables" panel automatically shows you the values of local variables. The "Watch" panel lets you enter expressions (like
*finalDamage) that will be continuously evaluated. You can even right-click a variable in the editor and select "Add to Watch."
To get this running smoothly, you need a one-time configuration via a file called launch.json. The following video walks you through this setup.
Easy C Debugging with VSCode & GDB
This video by Nick Walton provides a clear, step-by-step guide to setting up GDB debugging for C in VS Code.
First, watch the segment on basic debugging, which shows how to start a session and set breakpoints. Next, watch the more important section on configuring launch.json. This file tells VS Code where to find your executable and GDB itself. Pay special attention to the preLaunchTask setting, which is incredibly useful as it automatically recompiles your code every time you start a debug session.
A Practical Case Study: Finding a NULL Pointer
Let's see how these skills apply to a real-world problem. A "segmentation fault" is a very common crash in C, often caused by trying to dereference a NULL pointer. A debugger is the perfect tool to find the cause.
In a complex program, you might hit a breakpoint and find that a pointer is NULL. Where did that NULL value come from? To trace it back, you can examine the call stack and inspect processor registers, which hold the immediate values the CPU is working with.
gdb Debugging Full Example (Tutorial): ncurses
This excellent blog post by Brendan Gregg walks through a real, complex debugging session. We won't follow the entire analysis, but we'll extract key techniques relevant to our goals.
Read the following sections to see how a professional approaches debugging: Back Trace: The bt command shows you the chain of function calls that led to the current point. This is visible in VS Code's "CALL STACK" panel. Disassembly: The disas command shows the assembly code. This is advanced, but good to know it exists. Check Registers: The info registers (i r) command shows you the contents of CPU registers. The author finds the bug here: a register that should contain a memory address is zero (NULL). Memory Mappings: The info proc mappings command shows which memory address ranges are valid for your program, confirming that address 0x0 is not.
While you might not use info registers every day, knowing it exists reinforces the connection between C code, memory, and the underlying hardware—a key part of your learning goals.
Conclusion
Today you've acquired one of the most crucial skills for any serious C programmer: the ability to use a debugger to inspect a program's state. We've demystified the process by starting with the fundamental GDB commands and then mapping that knowledge to the convenient graphical interface of VS Code. You can now do more than just guess what your pointers are doing; you can see the addresses they hold and watch as your code modifies the data at those locations.
Key Takeaways:
- Compile with
-g: Always use the-gflag withgccto include the debug symbols necessary for effective debugging. - The Core Loop: Set breakpoints (
break), run the program (run), control execution (next,step), and inspect state (print,x). - Pointers in GDB: Use
print my_pointerto see the address it holds andprint *my_pointerto see the value at that address. - Raw Memory: The
xcommand is your tool for viewing the raw bytes at a specific memory address, cutting through layers of abstraction. - VS Code Integration: Your command-line knowledge directly translates to the VS Code debugger, which provides a more productive, visual workflow built on the power of GDB.
In our next lesson, we will discuss common pointer pitfalls, such as dangling pointers, uninitialized pointers, and the infamous null pointer dereference. The debugging techniques you've learned today will be your primary weapon for diagnosing and fixing these exact kinds of bugs when they appear in your own code.