Introduction
In the previous lesson, you successfully verified the end-to-end data path in your 4G lab, confirming that a software UE could pass IP traffic through the srsRAN eNB, the Open5GS core, and out to the internet. Your test lab is now fully operational.
However, in security research and testing, understanding failure is just as critical as achieving success. Configurations can be complex, and things will inevitably break. This lesson will equip you with the fundamental skills to figure out why. Our learning outcome is to use logs from srsRAN and Open5GS to diagnose a common connectivity failure. We'll explore where to find the essential log files and how to interpret them to systematically pinpoint the source of a problem.
1. The Troubleshooter's Toolkit: Logs and Packet Captures
Your background in cybersecurity has already made you proficient with tools like Wireshark and general log analysis. We'll apply those same principles here. A cellular network is just a distributed system, and its components leave a trail of breadcrumbs in their logs.
Locating the Key Log Files
First, you need to know where to look.
- Open5GS: By default, each core network component logs to its own file in
/var/log/open5gs/. For our 4G EPC, the most important ones are:mme.log: Handles UE connections, authentication, and mobility. This is often your first stop.hss.log: Manages subscriber data and authentication keys. Crucial for authentication issues.sgwc.log&sgwu.log: Control and User plane for the Serving Gateway.pgwc.log&pgwu.log: Control and User plane for the Packet Gateway.
- srsRAN: When you run
srsenbandsrsuefrom the command line, they log directly to the console (stdout/stderr). For our lab setup, this is convenient as we can watch the output in real-time in our terminal windows. In more advanced setups, this output can be redirected to files.
You can monitor logs in real-time using the tail command you're already familiar with. For example, to watch the MME log:
tail -f /var/log/open5gs/mme.log

Increasing Log Verbosity
Sometimes the default "info" level logs aren't enough. You can increase the verbosity to get more detail.
The Open5GS documentation provides a quick guide on troubleshooting, including how to increase the logging level. This is a fundamental step when you need more information to diagnose an issue.
Please read the section titled 'Further Debugging'. Note the different log levels available and the example of changing the level to 'debug' in a .yaml configuration file.
As the guide shows, you can edit the logger section in the relevant .yaml file (e.g., /etc/open5gs/mme.yaml) and change the level from info to debug or even trace. Remember to restart the service for the change to take effect.
Using Packet Captures
Text logs are great, but sometimes you need to see the raw protocol exchange. Your experience with Wireshark is a significant advantage here.
- srsRAN can be configured to write
.pcapfiles for different protocol layers (S1AP, RRC, etc.). - Open5GS doesn't have a built-in capture feature, but you can use
tcpdumpon the host machine to capture traffic on the relevant interfaces (e.g., the S1AP interface or theogstunuser-plane interface).
This video demonstrates capturing and analyzing the S1AP traffic between the eNodeB and the MME.
This video provides a practical walk-through of using tcpdump to capture the control plane traffic between the base station and the core network, and then analyzing it in Wireshark. This directly applies your existing skills to the cellular context.
Watch the segment from 14:36 to 18:20. The speaker uses tcpdump to capture traffic, transfers the file, and then opens it in Wireshark to analyze the S1AP messages. Focus on how the packet capture provides a detailed, message-by-message view of the eNB connection and UE attach procedures.
2. A Systematic Approach to Diagnosis
Troubleshooting should be methodical. Start from the core and work your way out toward the UE.
Step 1: Are the Core Services Running?
This is the most basic check. If a core component has failed to start, nothing else will work.
This official Open5GS guide covers the first steps of troubleshooting, starting with confirming that all services are active and checking the logs if they are not.
Review the section 'Services Running'. It shows how to check the status of all services and points you to the log files to find startup errors, often caused by misconfigurations in the .yaml files.
You can check the status of all Open5GS services with:
systemctl status open5gs-*
If any service is inactive or has failed, check its corresponding log file in /var/log/open5gs/ for an error message. It will usually point you directly to a misconfiguration in a .yaml file.
Step 2: Is the eNB Connected to the Core?
Once the core is running, the next step is the connection between your srsenb and the MME. This connection uses the S1AP protocol.
What Success Looks Like:
In your srsenb terminal, you'll see a message indicating a successful S1 Setup. In mme.log, you'll see a corresponding message.
# Example from mme.log
[mme] INFO: eNB-S1 accepted[10.0.1.14] in master_sm module (mme-sm.c:126)
Common Failure: S1 Setup Rejected
This often happens due to a mismatch in network identifiers between the eNB and MME.
This part of the Open5GS guide details how to diagnose eNB connection issues and lists the most common reasons for rejection.
Read the section 'gNB/eNB Connection Issues'. Pay close attention to the example log message for a refused connection and the typical reasons: MNC/MCC or Tracking Area Code (TAC) mismatch.
If you see an eNB-S1[x.x.x.x] connection refused!!! message in mme.log, the cause is almost always one of these two issues:
- PLMN ID Mismatch: The
mcc(Mobile Country Code) andmnc(Mobile Network Code) in yoursrsenbconfig (enb.conf) do not match thegummeilist in your MME config (mme.yaml). - TAC Mismatch: The
tac(Tracking Area Code) inenb.confis not listed in thetaisection ofmme.yaml.
Fixing it involves editing the configuration files to ensure these values are identical.
Step 3: Is the UE Attaching to the Network?
If the eNB is connected, the final step is the UE attach. This is where authentication happens.
Common Failure: Authentication Failure
This is extremely common when setting up custom SIMs. The credentials on the physical/software SIM must exactly match what's in the HSS database.
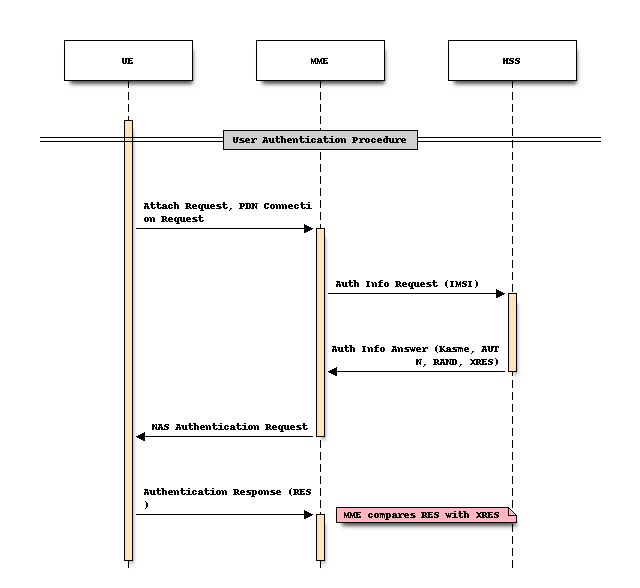
Now, let's see what happens when this fails.
This section of the troubleshooting guide is invaluable. It shows the exact log messages you will see in the HSS and MME logs for the two most common authentication failure scenarios.
Focus on the subsection 'UE Fails to Register/Attach to the Network'. Carefully examine the two failure cases and their corresponding log outputs.
By monitoring the logs, you can quickly distinguish between two problems:
- IMSI not found: The Open5GS WebUI doesn't have a subscriber with the IMSI your UE is presenting.
- Symptom: You'll see
WARNING: Cannot find IMSI in DBinhss.log. - Fix: Add the subscriber via the WebUI, ensuring the IMSI matches what you programmed onto your SIM.
- Symptom: You'll see
- Key mismatch: The subscriber exists, but the secret key (Ki) is wrong. The UE calculates an incorrect response, which the MME rejects.
- Symptom: You'll see
WARNING: Authentication failure(MAC failure)inmme.log. - Fix: Re-program your SIM using
pySimand update the subscriber record in the WebUI, making sure the Ki and OPC values are identical in both places.
- Symptom: You'll see
3. A Practical Diagnosis Scenario
Let's consider a more subtle issue that highlights the importance of checking logs on both sides of a connection.
The Problem:
You start srsenb and srsue. In the srsue console, you see messages indicating it is starting the "Random Access Procedure (RACH)", but it never gets any further. It seems stuck trying to make initial contact. You look at the srsenb console, and you see... nothing. It's not reporting any incoming connection attempts.
This scenario is described in the "Conclusion" of the following resource.
Open5GS and srsRAN 5G Network Log Analysis
This blog post about log analysis concludes with an excellent real-world troubleshooting example that perfectly illustrates the process of correlating logs from different components to solve a problem.
Read the 'Conclusion' section. The author describes a problem where the UE was sending a RACH message, but the gNB was not receiving it. Focus on the diagnostic process: confirming the message was sent via UE logs, and confirming it was not received via gNB logs, which isolated the problem to the physical link.
The Diagnostic Process:
- UE Log Analysis: The
srsuelog confirms the UE thinks it is transmitting the first RACH message. The problem is not with the UE software itself. - eNB Log Analysis: The
srsenblog shows no indication that it has received this message. - Conclusion: The communication is breaking down over the air (or in our case, the ZeroMQ "virtual air"). The UE is transmitting, but the eNB cannot decode the message.
As the resource explains, this could be due to a radio-level problem like the transmit power being too high or too low. While we won't dive into the complexities of radio link tuning, the troubleshooting method is the key takeaway: By comparing logs from the UE and the eNB, you can isolate the failure to the link between them.
Conclusion
You now have a structured methodology for diagnosing connectivity issues in your 4G lab. When something goes wrong, you don't have to guess; you can follow a logical process, guided by the logs.
Key Takeaways:
- Be Systematic: Troubleshoot from the inside out: Core Services -> eNB-to-Core link (S1AP) -> UE-to-Network link (Attach/Authentication).
- Know Your Logs: The primary Open5GS logs reside in
/var/log/open5gs/(mme.logandhss.logare crucial), while srsRAN logs appear on the console. - Correlate Information: The solution to a problem often requires looking at logs from multiple components (e.g., HSS and MME for authentication, or UE and eNB for radio link issues).
- Recognize Common Patterns: Be on the lookout for frequent errors like PLMN/TAC mismatches ("connection refused") and IMSI/key mismatches ("Cannot find IMSI", "Authentication failure").
Preview of the Next Lesson:
With a stable lab and the skills to fix it, you are now ready to pivot from building to breaking. In our next lesson, we will begin exploring the actual vulnerabilities of these systems. We will start by examining a classic attack vector with the learning outcome: Explain how weaknesses in GSM/2G (e.g., A5/1, one-way authentication) are exploited in downgrade attacks. This will be our first step into the offensive side of cellular security.