Hello! Welcome back to your accelerated course on Computational Structures.
In our last session, we established the "static discipline" and defined the four key voltage levels—, , , and —that create a robust digital abstraction. These parameters form a contract that allows digital devices to communicate reliably despite analog imperfections.
Today, we'll connect those abstract definitions to the physical reality of a circuit. Our goal is to analyze a voltage transfer characteristic (VTC) to extract logic levels. The VTC is a simple graph that plots a device's output voltage versus its input voltage, but it tells us almost everything we need to know about its static behavior. By the end of this lesson, you'll be able to look at a VTC and determine the precise logic levels for a given digital gate.
This skill is fundamental because it's how engineers characterize and validate the behavior of the digital building blocks used in everything from simple controllers to complex microprocessors.
1. What is a Voltage Transfer Characteristic (VTC)?
Imagine you have a digital device, like an inverter. You slowly sweep the input voltage () from low to high and, for each input value, you measure the resulting steady-state output voltage (). If you plot on the y-axis against on the x-axis, the resulting curve is the device's Voltage Transfer Characteristic.
To get a feel for what a VTC looks like and how it's measured, let's watch a short video from MIT OpenCourseWare. It uses a buffer (output = input) as an initial example, but the principle of plotting vs. is identical for all combinational devices.
2.2.6 Voltage Transfer Characteristic
This video introduces the VTC and the experimental setup used to measure it. It also relates the shape of the VTC to the 'static discipline' we discussed in the last lesson.
Watch from the beginning to 01:50. Focus on understanding that the VTC is a plot of Vout vs. Vin. Pay attention to the discussion of 'forbidden regions,' which directly connects to the valid logic levels we defined previously.
As the video shows, the VTC gives us a full picture of a device's static behavior. For an ideal inverter, the VTC would be a perfect step function: the output would be high for all inputs below a certain threshold and instantly switch to low for all inputs above it. However, real-world circuits don't switch instantly, which gives the VTC its characteristic 'S' shape.
2. Anatomy of a Realistic Inverter VTC
Now, let's dissect the VTC of a typical inverter to find our key logic levels. The image below shows a generic VTC with the important regions and points labeled.

As you can see, we can identify several key features on this graph:
-
High and Low Output Levels ( and ): These are the easiest to find. They correspond to the flat, "saturated" regions of the curve.
- is the output voltage when the input is a valid logic '0' (i.e., is low).
- is the output voltage when the input is a valid logic '1' (i.e., is high).
In a well-designed CMOS inverter, these values are typically equal to the power supply voltage (VDD) and ground (GND), respectively.
-
Input Logic Thresholds ( and ): This is the most critical part of the analysis. and define the edges of the "forbidden" or "undefined" input region. They are formally defined as the points on the VTC where the gain (), or the slope of the curve, is exactly -1.
- : The input low voltage. It is the point on the upper part of the transition where the slope first reaches -1. For any input below , the device is guaranteed to see a '0'.
- : The input high voltage. It is the point on the lower part of the transition where the slope once again reaches -1. For any input above , the device is guaranteed to see a '1'.
Why is the gain of -1 so important?
The region between and is the transition region, where the circuit acts like an amplifier (gain > 1). This high gain ensures a fast and sharp switch. Outside this region (gain < 1), the output is less sensitive to small changes in the input, which provides stability at the '0' and '1' logic states. The points where the gain is -1 are the conventional boundaries of this unstable transition region.
To see these definitions presented in the context of a real nMOS inverter, let's read a short section from a textbook on MOS devices.
MOS Inverters: Static Characteristics
This text provides a more formal introduction to the VTC of a realistic inverter. It clearly defines the five critical voltage points, with a focus on how VIL and VIH are determined by the slope of the characteristic.
Please read the section titled 'Voltage Transfer Characteristic (VTC)' on pages 143-145. Focus on Figure 5.4, which is very similar to the image above, and the definitions of VOH, VOL, VIL, and VIH. Note the specific definition of VIL and VIH based on the slope condition.
3. Worked Example: Extracting Logic Levels
Now let's apply this knowledge. Your exam will likely present you with a VTC and ask you to extract these parameters. Let's work through a typical problem.
Consider the VTC for a logic inverter shown in the image below. We are asked to determine its DC characteristics.
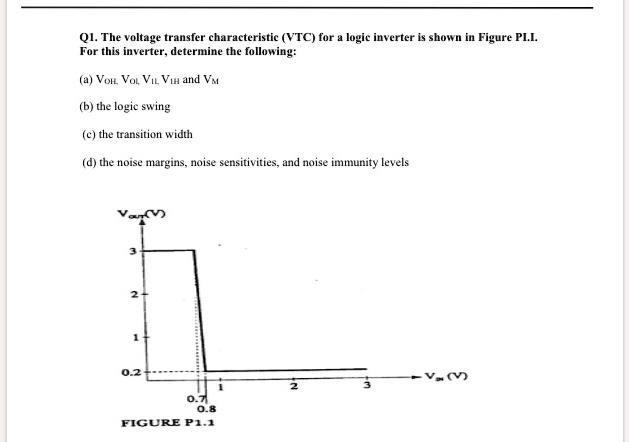
Let's find the logic levels step-by-step.
Step 1: Determine and
These are the "flat" regions of the output voltage.
- By looking at the y-axis when is near 0, we can see the high output voltage is .
- By looking at the y-axis when is high (e.g., at 3V), we see the low output voltage is .
Step 2: Determine and
These are the input voltages where the slope of the VTC is -1. In many textbook problems, these "knee" points of the curve are given or can be estimated as the boundaries of the sharp transition.
- From the graph, the output begins to drop sharply around . We will take this as .
- The curve starts to flatten out into the low state after . We will take this as .
Step 3: Calculate the Noise Margins
Now that we have all four parameters, we can calculate the noise margins using the formulas from our previous lesson.
- High Noise Margin (_H):
- Low Noise Margin (_L):
This inverter is significantly more robust against noise when its output is high than when it is low. This asymmetry is common in some logic families.
Step 4 (Bonus): Find the Switching Threshold ()
The switching threshold () is the input voltage where . We can estimate this by finding where the line would intersect the VTC. For this graph, it would be somewhere between 0.7V and 0.8V, likely around .
Conclusion
In this lesson, you learned how to bridge the gap between the abstract concept of logic levels and the concrete behavior of a physical device. The VTC is a powerful tool that allows us to do just that.
Here are the key takeaways:
- The Voltage Transfer Characteristic (VTC) is a plot of vs. that graphically represents the static behavior of a digital gate.
- and can be read directly from the high and low flat portions of the VTC.
- and are formally defined as the input voltages where the slope of the VTC is -1. These points mark the boundaries of the high-gain transition region.
- By extracting these four levels from the graph, you can characterize a device and calculate its noise margins, giving you a quantitative measure of its robustness.
Preview of the Next Lesson
We calculated the noise margins in our example, but what do those numbers really mean for a circuit designer? In our next lesson, we will focus entirely on that question. We will calculate noise margins to determine the robustness of a digital circuit, exploring why large and symmetric noise margins are desirable and what happens when they are violated.