Hello! Welcome back to Module 11.
In our last lesson, we designed the operational heartbeat of the finance department: the monthly close and reporting calendar. We mapped out the process, defined the roles of Accounting and FP&A, and established the timeline for transforming raw data into final numbers. That was the "how" and the "when."
Today, we focus on the "what": the actual deliverable that this process produces. This lesson addresses the learning outcome: Assemble a core financial reporting package including financial statements, variance analysis, and key metrics. This package is the primary communication tool FP&A uses to inform leadership about business performance, and mastering its creation is a fundamental skill for any analyst.
We will break down the package into its three essential components and learn how to construct and interpret the most critical part: variance analysis.
1. The Foundation: Financial Statements
The core financial statements—the Income Statement (P&L), Balance Sheet (BS), and Cash Flow Statement (CFS)—are the bedrock of any reporting package. As we established in the previous lesson, the accounting team is responsible for preparing and finalizing these statements during the close process.
Your role in FP&A is not to create these from scratch but to:
- Ensure they are presented in a clear, consistent, and easy-to-read format.
- Use them as the primary source of "truth" for your analysis.
Think of the financial statements as the official blueprint of the company's performance for the period. Our job is to add the analysis and commentary that explains what the blueprint means.
2. The Core Analysis: Variance Analysis
While the financial statements tell you what happened, variance analysis tells you why it happened. This is where FP&A provides its most significant value. According to the Institute of Management Accountants (IMA), variance analysis is the "investigation of the causes of the variances between actual costs and standard or budgeted cost."
Your goal is to move beyond stating the obvious ("Revenue was down by 5%") to providing actionable insight ("Revenue was down by 5% because our new product launch was delayed by two weeks, causing a volume shortfall of 1,000 units").
Decomposing the Total Variance
A common mistake is to compare actual results directly to the original (static) budget. If you sold more units than planned, of course your costs will be higher! This doesn't necessarily mean you were inefficient. To perform a more insightful analysis, we need to break down the total variance.
To understand these concepts, we'll use a slide deck that introduces the hierarchy of variances from a static budget down to more detailed levels.
Flexible Budgets, Variance Analysis and Management ...
This presentation, 'Flexible Budgets, Variance Analysis and Management,' provides a structured way to think about variances. It will introduce you to the crucial difference between a static and a flexible budget, which is key to isolating performance issues.
Please review the following sections of the presentation: Start at the beginning to understand the definitions of Static vs. Flexible Budgets and Favorable vs. Unfavorable variances. Follow the 'Sofiya Company' example to see a Level 1 analysis, which calculates the static-budget variance. Read the 'Steps in developing a flexible budget' to understand how to adjust the budget for the actual volume. Finally, study the definitions of Flexible-budget variance and Sales-volume variance. Focus on how using a flexible budget helps you separate the impact of sales volume from the impact of operational performance.
Let's summarize the key concepts from that reading:
- Static Budget: Prepared for one level of activity (e.g., a plan to sell 12,000 units).
- Flexible Budget: The original budget adjusted for the actual level of activity (e.g., what costs should have been to sell the 10,000 units that were actually sold).
- Sales-Volume Variance: The difference between the Flexible Budget and the Static Budget. This variance isolates the impact of selling a different quantity than planned.
- Flexible-Budget Variance: The difference between Actual Results and the Flexible Budget. This variance isolates how well you managed revenues and costs, given your actual sales volume. It answers the question: "For the volume we achieved, did we spend more or less than we should have?"

Digging Deeper: Price and Efficiency Variances
We can decompose the flexible-budget variance even further to get more specific insights. This is especially relevant given your engineering background, as it mirrors concepts of process efficiency.
The two main drivers of cost variances are:
- Price Variance: You paid more or less for your inputs (e.g., materials, labor) than planned.
- Efficiency Variance: You used more or less of your inputs for the output you produced than planned.
Let's return to the slide deck to see how these are calculated.
Flexible Budgets, Variance Analysis and Management ...
This next section of the presentation dives into Level 3 analysis, breaking down the flexible-budget variance.
Please read the section titled 'Price variances and efficiency variances for inputs' (starting around slide 17). Pay close attention to the formulas and the interpretation of what causes an unfavorable variance for each type.
The formulas are:
An unfavorable efficiency variance in manufacturing, for example, means you used more material or labor-hours than the standard allowed for the number of units you produced—a concept very similar to material waste or low productivity in an engineering project.
Test your understanding!
A company budgets to sell 1,000 units at $50 each. The budgeted variable cost is $20 per unit.
Actual results: they sold 900 units at $52 each. The actual total variable cost was $19,800.
- What is the Static Budget for Operating Income (assuming no fixed costs for simplicity)?
- What is the Flexible Budget for Operating Income?
- Calculate the Sales-Volume Variance and the Flexible-Budget Variance. Is each one favorable or unfavorable?
Show answer
-
Static Budget Operating Income:
- Revenue: 1,000 units * $50/unit = $50,000
- Variable Costs: 1,000 units * $20/unit = $20,000
- Operating Income: $50,000 - $20,000 = $30,000
-
Flexible Budget Operating Income (based on 900 actual units):
- Revenue: 900 units * $50/unit = $45,000
- Variable Costs: 900 units * $20/unit = $18,000
- Operating Income: $45,000 - $18,000 = $27,000
-
Variances:
- Sales-Volume Variance = Flexible Budget OI - Static Budget OI
- $27,000 - $30,000 = -$3,000 (Unfavorable). This is purely due to selling 100 fewer units.
- Flexible-Budget Variance = Actual OI - Flexible Budget OI
- Actual Revenue = 900 units * $52/unit = $46,800
- Actual Variable Costs = $19,800
- Actual OI = $46,800 - $19,800 = $27,000
- $27,000 - $27,000 = $0. In this case, the favorable price variance ($2/unit * 900 units = +$1,800) was perfectly offset by the unfavorable cost variance (Actual cost/unit was $19,800/900 = $22, which is $2/unit over budget; $2 * 900 = -$1,800).
- Sales-Volume Variance = Flexible Budget OI - Static Budget OI
3. The Snapshot: Key Metrics (KPIs)
While variance analysis provides the detailed story, executives also need a high-level snapshot of performance. This is where Key Performance Indicators (KPIs) come in.
A reporting package should always include a dashboard or summary of the most critical metrics that drive the business.
Key Principles of Effective Financial Planning and Analysis
The 'Key Principles of Effective Financial Planning and Analysis' statement from IMA provides context on the strategic importance of KPIs.
Please read the following sections from this report: Principle 9: 'Identify what drives business success and develop key performance indicators (KPIs) for those drivers.' Principle 12: 'Monitor results of KPIs and link to financial incentives.' Finally, look at the Glossary of Terms at the end for the definition of 'Key performance indicator (KPI).' This will help you understand that KPIs aren't just random numbers, but carefully selected metrics tied to business strategy.
As the reading highlights, good KPIs are directly linked to the strategic drivers of the business. A monthly reporting package should feature a mix of:
- Profitability Metrics: Gross Margin %, EBITDA Margin, Net Income %.
- Operational Metrics: These are often non-financial and industry-specific (e.g., Revenue per Employee, Customer Churn Rate, Daily Active Users).
- Balance Sheet Metrics: Days Sales Outstanding (DSO), Days Inventory Outstanding (DIO), Cash Conversion Cycle.
We will explore the calculation and interpretation of many of these ratios in detail in Module 6. For now, understand that they are a vital part of the summary section of your reporting package.
4. Assembling the Final Package
Now, let's put it all together. A standard monthly financial reporting package delivered to the CFO or executive team typically follows this structure:
-
Executive Summary (1 Page):
- Narrative: 3-5 bullet points explaining the key story of the month. What were the main wins and losses?
- KPI Dashboard: A small table or set of visuals showing the top 5-10 KPIs vs. budget and prior year.
- Key Financials Summary: A condensed P&L showing Actual vs. Budget variance.
-
Detailed Variance Analysis (2-5 Pages):
- Full Income Statement with Actual vs. Budget vs. Prior Year variance analysis.
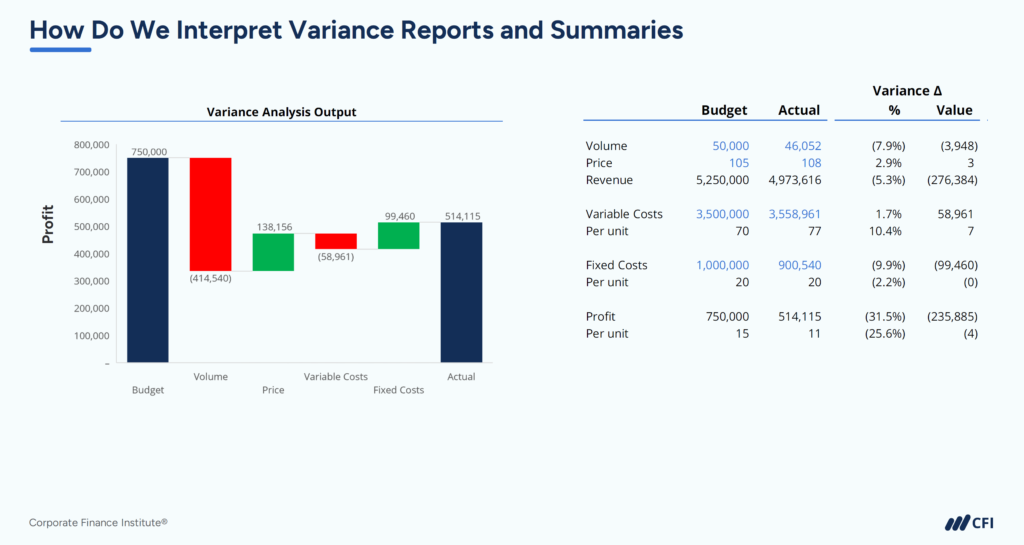
- Waterfall charts breaking down revenue and profit variances.
- Commentary next to key lines explaining the business drivers of the variances. This is crucial!
-
Departmental / Segment Analysis (As needed):
- P&L variance reports for each major department (Sales, Marketing, R&D, G&A) so budget owners can see their specific performance.
-
Core Financial Statements (Appendix):
- The full, formal Income Statement, Balance Sheet, and Statement of Cash Flows as provided by accounting.
The key is to tell a story that flows from a high-level summary to granular detail, allowing a reader to get the main message in 60 seconds or spend 20 minutes digging into the specifics.
Conclusion
You now understand the components of a core financial reporting package and the analytical engine that drives it. This package is the tangible output of the FP&A monthly cycle and a primary vehicle for communicating performance to leadership.
Key Takeaways:
- A reporting package is built on a foundation of financial statements and brought to life with variance analysis and key metrics (KPIs).
- Flexible budgets are essential for separating the impact of sales volume from operational performance.
- Variance analysis seeks to explain the business reasons behind the numbers, moving from "what" to "why."
- The final package should be structured like a pyramid, starting with a high-level executive summary and allowing for a drill-down into details.
Preview of the Next Lesson:
We've assembled the numbers and the structure. But the most human—and often most challenging—part is writing the story that goes with it. In our next lesson, we will learn how to draft effective management commentary (MD&A style) to narrate financial results and explain key business drivers.