Hello! Welcome to your next lesson in the "Budgeting, Planning, and Variance Analysis" module.
In our last session, we built a dynamic rolling forecast. This is a crucial tool for looking into the future of a business unit. However, most companies are more complex than a single unit; they consist of multiple departments, divisions, or even separate legal entities. As an FP&A analyst, your role is to bring these individual pieces together to create a cohesive, company-wide financial picture.
Today, we'll tackle that challenge head-on. This lesson addresses the learning outcome: Structure a chart of accounts and build a consolidation model to aggregate multiple departmental or entity budgets. We'll start by understanding the "common language" of financial data—the Chart of Accounts—and then dive into the practical Excel techniques for building a model that aggregates data from different sources.
1. The Blueprint: Structuring a Chart of Accounts (CoA)
Before you can aggregate anything, the data needs to be organized consistently. Imagine trying to build a structure where one engineering team calls a support beam a "girder" and another calls it a "joist." You'd have a difficult time tallying your total materials. The same principle applies in finance.
A Chart of Accounts (CoA) is a company's financial organizational tool. It's a complete, structured list of every account in the general ledger, from revenue to expenses to assets and liabilities. Each account is typically assigned a unique number for easy identification.
For an FP&A analyst, the CoA is critical for two reasons:
- Consistency: It ensures that a "Software License" cost in the Sales department is recorded in the same account as a "Software License" cost in the Finance department.
- Aggregation: This consistency allows you to "roll up" or consolidate financial data. You can confidently sum up all expenses in account
7450 - Software Licensesacross all departments to get a true company-wide total.
A typical CoA is hierarchical. For example:
60000 - Operating Expenses(Level 1 Category)63000 - Marketing & Advertising(Level 2 Sub-category)63100 - Digital Advertising(Level 3 Account)63200 - Trade Shows(Level 3 Account)
As an analyst, you won't usually design the CoA from scratch (that's more of an accounting function), but you must understand its structure to build your models correctly.
2. Building a Consolidation Model in Excel
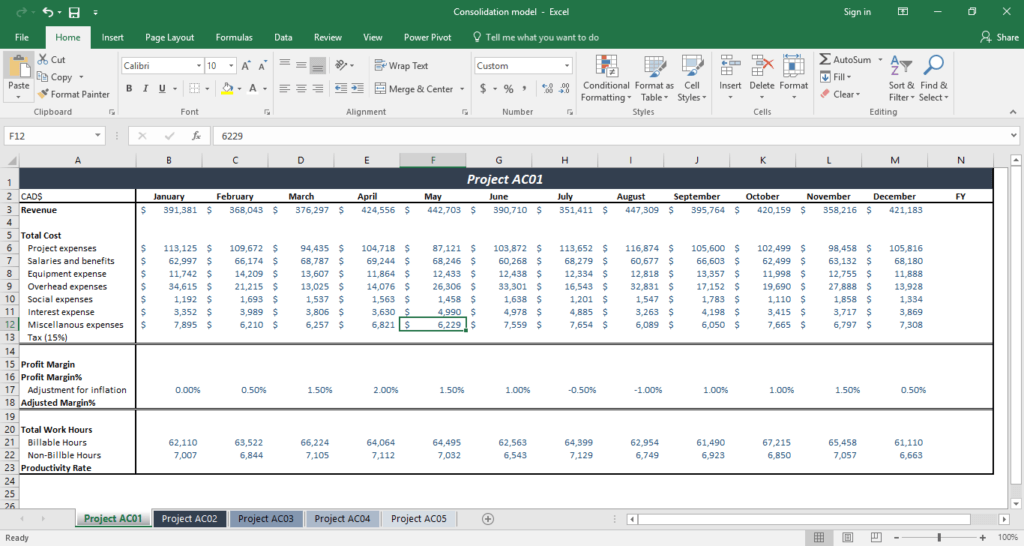
With a standardized CoA, we can now build a model to aggregate data. A consolidation model pulls financial results from multiple sources (worksheets, workbooks) into a single summary view.
Let's begin by understanding the general process.
Learn How to Build a Consolidation Model
The article 'Learn How to Build a Consolidation Model' from Corporate Finance Institute outlines the key steps involved in creating a consolidation model, from structuring the individual data tabs to building the final summary.
Please read the introduction ('What is a Consolidation Model?') and the 'Building a Consolidation Model' section. Focus on the overall workflow: setting up individual tabs for each unit, using cell references to link data to a summary sheet, and presenting the final output.
As the article illustrates, the core idea is to have separate, detailed tabs for each department or entity and a summary tab that pulls everything together. Now, let's explore three practical methods to achieve this in Excel, each with its own pros and cons.
Method 1: The Direct Linking ("3D") Formula
This is the most straightforward method. If your source worksheets for each department (e.g., "Sales", "Ops", "Finance") have the exact same layout, you can use a "3D" SUM formula.
For example, to sum cell B5 from all sheets between "Sales" and "Finance", the formula is:=SUM(Sales:Finance!B5)
- Pros: Very quick and easy to implement.
- Cons: Extremely brittle. If someone inserts a row or column in just one of the source sheets, the references will misalign, leading to incorrect totals without any obvious error message. It's generally not recommended for robust, long-term models.
Method 2: Formula-Based Consolidation (The Flexible Approach)
A much more robust method uses functions like SUMIFS to look up and aggregate data based on the account names or numbers from your Chart of Accounts. This approach doesn't depend on the data being in the same cell on every sheet.
The following resource provides a framework for this, although we will adapt its SUMIF suggestion to the more powerful SUMIFS function you've already learned.
Manage Group Financial Consolidation in Excel
The article 'Manage Group Financial Consolidation in Excel' demonstrates a formula-based approach. We will focus on its principles for structuring the data.
Read the sections 'Create the Master Data Structure' and 'Set Up Source Data References'. Pay attention to the idea of having a central 'Consolidation' sheet and a separate 'SourceList' sheet that lists all the departments. This structure is key to building a scalable model.
Let's build on that concept. Imagine you have:
- A Consolidation sheet with a list of all your CoA expense accounts in column A.
- Tabs for each department (
Sales_Data,Ops_Data), where column A is the account and column B is the budget amount.
In your Consolidation sheet, to sum the budget for the account listed in cell A2, a simple approach would be:=SUMIFS(Sales_Data!B:B, Sales_Data!A:A, A2) + SUMIFS(Ops_Data!B:B, Ops_Data!A:A, A2) + ...
This works, but it's manual and error-prone. Every time you add a new department, you have to edit every formula.
Pro-Level Technique: A superior way is to combine SUMIFS with the INDIRECT function. INDIRECT turns a text string into a valid cell reference.
- Create a
SourceListsheet that lists the names of all your data tabs (e.g., "Sales_Data" in cell A1, "Ops_Data" in cell A2). - Use a formula that loops through this list. While there are advanced ways to do this with dynamic arrays, a common method is to use helper columns or a
SUMPRODUCTapproach. For now, the key takeaway is that by centralizing your sheet names in a list, you can create formulas that scale easily when new departments are added.
Test your understanding!
You have built a consolidation model using the SUMIFS method (the simple version, by adding multiple SUMIFS together). The company just created a new "Marketing" department with its own budget sheet. What are the minimum steps required to update your consolidation model? What is the main risk with this process?
Show answer
Steps:
- For every single account row in your consolidation sheet, you must manually edit the formula.
- You would add
+ SUMIFS(Marketing_Data!B:B, Marketing_Data!A:A, A2)to the end of each formula.
Risk: The main risk is human error. It's very easy to miss updating a formula for one of the accounts, leading to an incomplete consolidation that silently misrepresents the company's total budget. This is why scalable methods (like using INDIRECT or the Consolidate tool below) are preferred.
Method 3: Excel's Built-in Consolidate Tool
Excel has a dedicated tool for this exact task, which many users overlook. It's powerful because it can aggregate data either by position or by category, without requiring complex formulas.
Manage Group Financial Consolidation in Excel
The 'Pro Tips' in the same article explain how to use Excel's built-in 'Consolidate' feature, which is a fantastic alternative to manual formulas.
Navigate to the 'Pro Tips' section and read the first two tips: 'Use Consolidate by Position' and 'Leverage Consolidate by Category Labels'. Focus on the difference between these two modes.
To find this tool, go to the Data tab in Excel, and in the Data Tools group, click Consolidate.
-
Consolidate by Position: This works like the 3D
SUMformula. It assumes the data you want to sum is in the same location on every source sheet. It's quick but shares the same brittleness. -
Consolidate by Category (Labels): This is the most powerful option. By checking the "Top row" and/or "Left column" boxes, you tell Excel to use the labels (i.e., your Chart of Accounts names and time periods) to match the data. This means the "Salaries" expense can be in row 5 on the Sales sheet and row 8 on the Ops sheet, and Excel will still correctly sum them together. This directly leverages the power of a standardized CoA.
Bonus Tip: When using the Consolidate tool, checking "Create links to source data" will create a summary with an expandable outline. This allows you to drill down into the consolidated numbers to see which values came from which source sheet, which is invaluable for auditing and analysis.

Conclusion
Today, you've learned how to manage the complexity that arises when a business operates with multiple departments or entities. You can now structure and aggregate financial data to create a single, unified view of the organization.
Key Takeaways:
- A Chart of Accounts (CoA) is the standardized "common language" that makes consolidation possible by ensuring consistent data classification.
- Consolidation models in Excel aggregate data from multiple sources into a summary view.
- You have several tools at your disposal:
- Direct Linking (
SUM(Sheet1:Sheet2!B5)): Simple but brittle; only for identical layouts. - Formula-Based (
SUMIFS): Flexible and robust, especially when made scalable with techniques like using a source list. - Data > Consolidate Tool: A powerful, no-formula method that can handle non-identical layouts by matching category labels (your CoA).
- Direct Linking (
In our next lesson, we will put this consolidated data to work. Now that we have aggregated actual results from across the company, we'll learn how to create a detailed variance analysis report to compare these results against the budget and forecast, uncovering the key drivers of business performance.