Hello! Welcome to your next lesson in the Financial Performance and Profitability Analysis module.
In our last session, we dissected company performance by product line using contribution and segment margins. We made a crucial distinction between direct fixed costs (traceable to a segment) and common fixed costs (shared across the company). We concluded that while a segment's own performance is best measured by its segment margin, we were still left with a large pool of common, shared costs. Simply spreading these costs evenly or based on sales revenue can be misleading.
Today, we'll solve that problem. This lesson directly addresses the learning outcome: Develop methodologies to allocate shared corporate costs to perform customer and channel profitability analysis.
You'll learn the primary methodology used in modern finance to allocate these overheads in a logical, cause-and-effect manner. This will allow us to move beyond product profitability and answer more nuanced questions:
- Which customers are the most and least profitable to serve?
- Which sales channels (e.g., online, retail, wholesale) are creating the most value?
Answering these questions is a core FP&A function that drives crucial strategic decisions about pricing, service levels, and customer focus.
1. From Arbitrary Allocations to Activity-Based Costing (ABC)
Traditionally, companies allocated shared costs like rent, utilities, and administrative salaries using a simple basis, such as a percentage of sales. This approach has a major flaw: it assumes all customers consume resources in proportion to their revenue.
Consider two customers who each generate $1 million in revenue.
- Customer A places one large, simple order per month.
- Customer B places 50 small, complex orders, requires constant customer service calls, and frequently requests expedited shipping.
Under a simple allocation method, both customers appear equally profitable. But intuitively, we know Customer B is far more costly to serve. To get an accurate picture, we need a method that connects costs to the activities that drive them. This method is Activity-Based Costing (ABC).
The core idea of ABC is:
- Activities (like processing orders or handling service calls) are what consume company resources and create costs.
- Customers, products, and channels are what consume those activities.
To understand the mechanics, let's start with a foundational video that walks through a full example.
Customer Profitability Analysis (Activity Based Costing)
The video 'Customer Profitability Analysis (Activity Based Costing)' from the Edspira channel provides a clear, step-by-step demonstration of how to apply ABC to determine the profitability of different customer types.
Please watch from the beginning up to the 8:29 mark. As you watch, focus on the key steps of the process: Identifying Cost Pools: How indirect costs are grouped into 'buckets' based on the activity (e.g., Ordering, Product Design, Customer Service). Identifying Cost Drivers: What measure is used for each activity? (e.g., number of customer orders, number of product designs). Calculating Activity Rates: The simple but crucial calculation of (Total Cost in Pool) / (Total Cost Driver Volume) to get a per-activity rate (e.g., $2.00 per order). Allocating Costs: How the activity rates are multiplied by each customer's specific activity level to assign them their share of the indirect costs.
The video demonstrates the fundamental workflow. For a more formal definition and a list of common "hidden" costs that ABC can uncover, the following reading is helpful.
Customer Profitability Analysis
This document, 'Customer Profitability Analysis' from Strategic Finance, provides a professional overview of the topic. We'll look at two key parts.
Please read the following two sections: Start at the heading 'ANALYZING CUSTOMER PROFITABILITY' and read the subsection 'How ABC Improves Understanding of Product and Customer Profitability' (page 13). This formally outlines the five steps of ABC. Continue to the next subsection, 'Customer Profitability Analysis' (page 13). Pay special attention to the bulleted list of 'hidden customer costs' on page 14 that ABC helps to assign correctly.
2. The Strategic Insight: The "Whale Curve" of Profitability
After completing an ABC analysis, FP&A teams can create a complete profitability report for each customer or channel. The result is often surprising and turns conventional wisdom on its head.
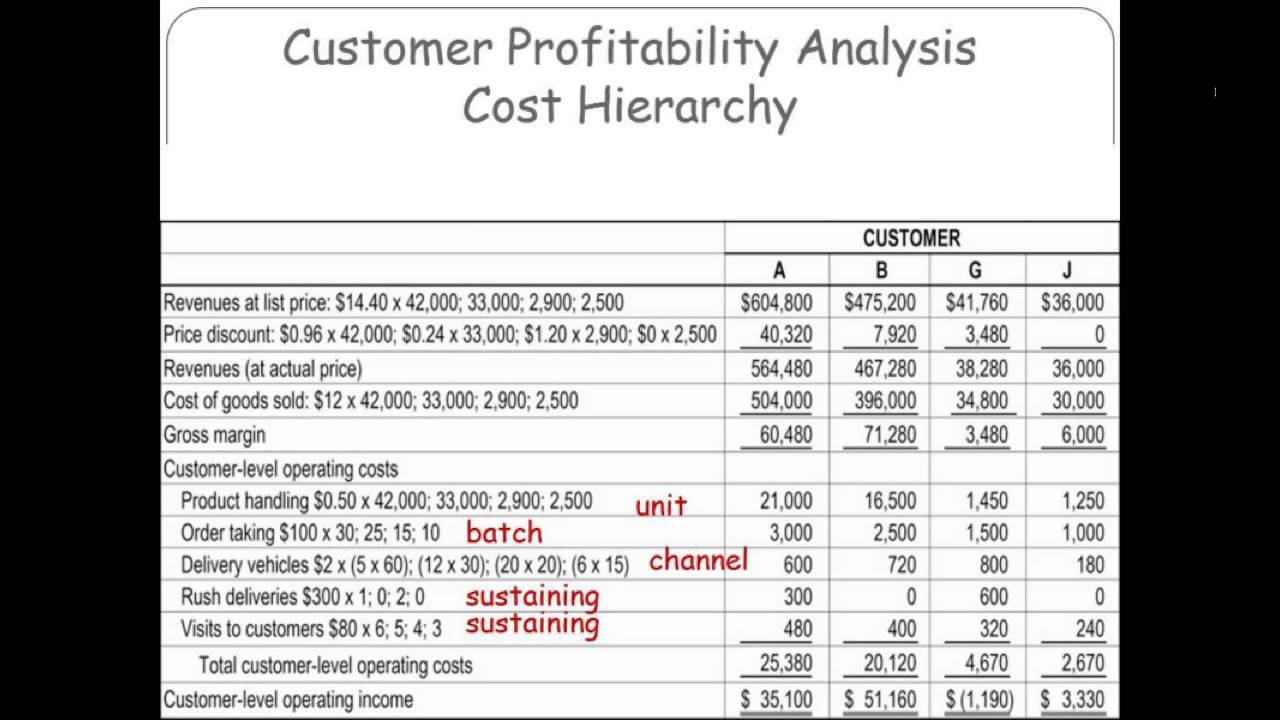
When customers are ranked from most to least profitable, the cumulative profit often forms a shape known as the "whale curve." It typically reveals that:
- The most profitable 20% of customers generate 150-300% of total profits.
- The middle 60-70% of customers are roughly break-even.
- The least profitable 10-20% of customers actually lose so much money that they erode 50-200% of the profits.
This discovery—that your biggest customers are not always your best customers—is one of the most powerful insights an FP&A analyst can provide.
Let's look at a classic case study that demonstrates this phenomenon.
Customer Profitability Analysis
The 'Kanthal case' within the same 'Customer Profitability Analysis' document is a famous example from Harvard Business School that illustrates the power of ABC.
Please read the section 'Customer Profitability Analysis in a Manufacturing Company' (pages 17-19). Focus on: The company's initial assumption versus what the ABC analysis revealed about its customers. The 'whale curve' concept shown in Exhibit 12. The actions Kanthal took after the analysis to turn its most unprofitable customer into one of its most profitable.
As the Kanthal case shows, the goal isn't just to "fire" unprofitable customers. The analysis opens the door to strategic actions like repricing, changing customer behavior, or redesigning service models.
3. A Deeper Dive: Allocating Costs Between Support Departments
Our ABC example was straightforward because the indirect costs (like ordering and customer service) were directly linked to operating activities. But what about corporate overhead from departments like Human Resources (HR) or Information Technology (IT)? These are support departments that often serve other support departments in addition to the main operating divisions.
For example, the IT department supports the sales team, but it also supports the HR department. The HR department hires for the factory, but it also hires for the IT department. How do we allocate these costs without double-counting or creating infinite loops?
There are three primary methodologies.
3 Ways to Allocate Costs to Multiple Support Departments (Direct, Step-down, and Reciprocal methods)
This video, '3 Ways to Allocate Costs to Multiple Support Departments' from Edspira, explains the standard methods for handling these inter-support department costs.
Watch the explanations of the three methods. You don't need to memorize the calculations, but understand the conceptual difference: Direct Method (0:57): The simplest. Ignores any services provided between support departments and allocates their costs directly to operating divisions. Step-Down Method (2:48): A sequential process. Ranks support departments and allocates their costs down the line. It's partially accurate but doesn't capture the full two-way relationship. Reciprocal Method (5:26): The most accurate, as it fully recognizes all mutual services between departments using simultaneous equations. In practice, this is typically handled by sophisticated ERP software.
For an FP&A analyst, the key is to know these methods exist and understand the trade-off between simplicity and accuracy. The step-down method is a common and practical compromise.
Test your understanding!
A company has two support departments (IT and Admin) and two operating departments (Sales and Manufacturing). You are using the Direct Method to allocate costs.
The IT department's total cost is $100,000. It provides 50% of its services to Sales, 30% to Manufacturing, and 20% to the Admin department.
How much of the IT department's cost will be allocated to the Admin department?
Show answer
Zero.
Under the Direct Method, any services provided by one support department to another are ignored. The IT department's costs are allocated directly to the operating departments only. The allocation base would be re-calculated using only the 80% of services provided to Sales and Manufacturing.
4. Modern Application: Cost-to-Serve (CTS) Analysis
In today's business environment, particularly in companies with complex supply chains, this type of analysis is often called Cost-to-Serve (CTS). It applies the principles of ABC to the entire value chain to understand the total cost of fulfilling a customer's order, from manufacturing down to final delivery.
This framework is highly relevant for your goal of becoming an FP&A analyst, as it integrates financial analysis with operational data.
Excel Cost-to-Serve Analysis by SKU, Channel, and Region
This article, 'Excel Cost-to-Serve Analysis by SKU, Channel, and Region', frames our topic in the language of a modern FP&A professional.
Please read the 'Executive Summary' and 'Business Context' sections. They are short but will help you connect today's concepts to your career goals. Notice the emphasis on: Granularity: Analyzing by SKU (Stock Keeping Unit), channel, and region. Tools: The direct mention of Excel, Power Query, and PivotTables as the tools for this analysis. Reinforcement of ABC: It confirms that Activity-Based Costing is the core framework for this type of work.
Conclusion
Today we've added a powerful and essential methodology to your FP&A toolkit. You've learned how to move beyond simple, often misleading cost allocations and apply Activity-Based Costing to reveal the true profitability of customers and channels.
Key Takeaways:
- Traditional methods of allocating shared costs based on volume can distort profitability and lead to poor decisions.
- Activity-Based Costing (ABC) provides a more accurate picture by linking costs to the activities that drive them, and then linking those activities to customers or channels.
- The output of a customer profitability analysis often reveals a "whale curve," where a minority of customers drive the majority of profits.
- This analysis enables strategic actions beyond just "firing" unprofitable customers, such as repricing, encouraging different buying behaviors, or changing service levels.
- For allocating costs between support departments (like HR and IT), you can use the Direct, Step-Down, or Reciprocal methods, each with a different level of accuracy.
In our next lesson, we will shift gears slightly to another critical profitability metric: Adjusted EBITDA. You'll learn how companies calculate this non-GAAP measure by starting with Net Income and making specific adjustments, including for some of the shared overhead costs we discussed allocating today.