Hello! Welcome to your next lesson in the "Cash Flow and Working Capital Management" module.
In our previous lesson, we modeled a revolving credit facility, creating the logic for cash drawdowns and repayments. This dynamic "plug" ensures our model can handle projected cash shortfalls and surpluses. But once you've modeled these complex movements, how do you communicate them clearly and effectively to management? A table of numbers can be dense and hard to interpret.
Today, we'll learn a powerful data visualization technique to solve this problem. Your learning outcome is to create cash waterfall charts to visualize sources and uses of cash over a period. A waterfall chart, also known as a bridge chart, tells the story of your cash flow, breaking down how you get from a starting cash balance to an ending balance, one step at a time. This is a crucial skill for any FP&A analyst responsible for explaining financial performance.
1. Understanding the Waterfall Chart
A waterfall chart is designed to show the cumulative effect of sequentially introduced positive and negative values. In the context of cash flow, it perfectly illustrates the journey of your cash over a period:
- Start: Beginning Cash Balance
- Increases (Sources): Cash from operations, new debt, etc.
- Decreases (Uses): Capital expenditures, debt repayments, etc.
- End: Ending Cash Balance
Each source of cash is a "step up," and each use of cash is a "step down," forming a bridge to the final value.
To start, let's get a clear definition and see some examples of how these charts are used in finance.
Excel Waterfall Charts: The Easiest Way
This article from Zebra BI, 'Excel Waterfall Charts: The Easiest Way', provides an excellent introduction to what waterfall charts are and where they are used.
Please read the first section, 'Waterfall charts 101,' down to the 'How to create a waterfall chart in Excel' heading. Focus on the definition of a waterfall chart versus a bridge chart and the common business uses, such as visualizing profit & loss statements and cash flow.
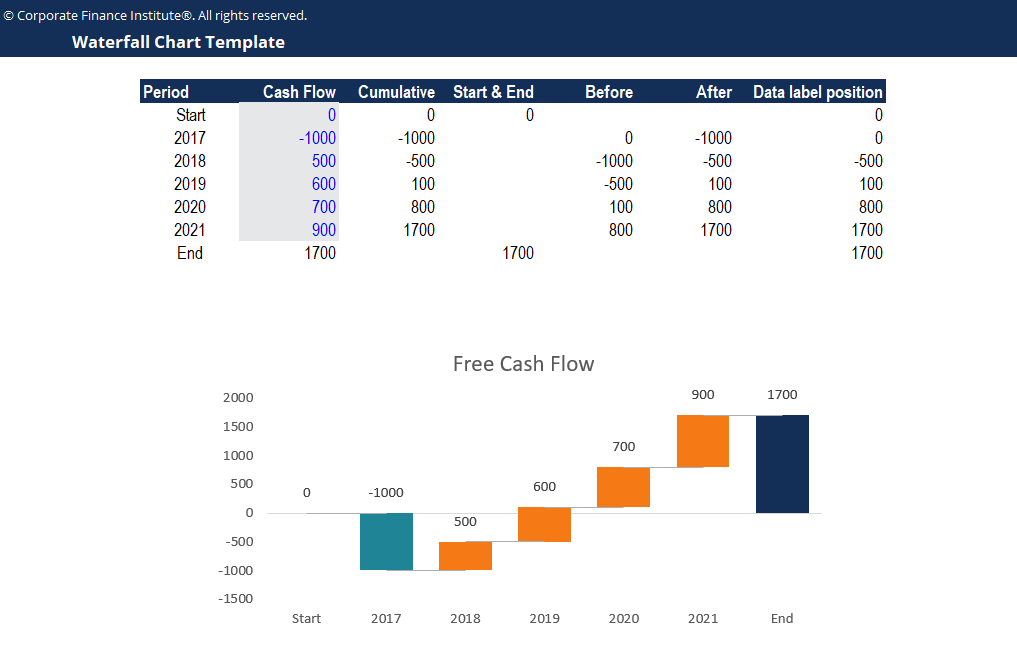
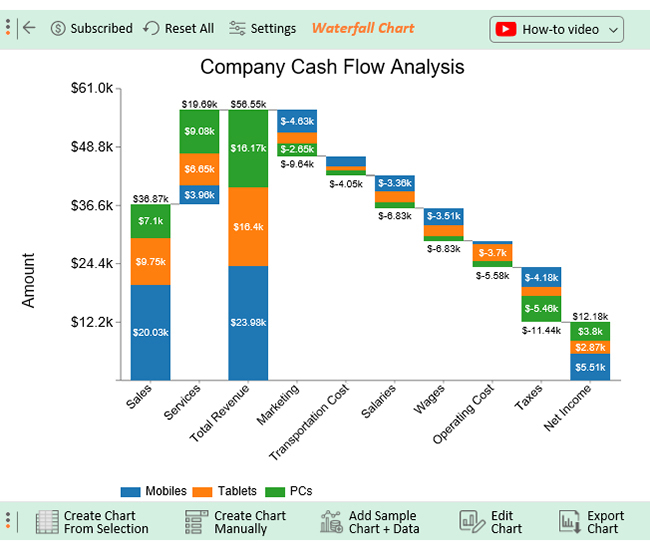
Here are two examples of what a finished cash waterfall chart looks like.
2. Method 1: The Built-in Excel Waterfall Chart
Since Excel 2016, a native waterfall chart function has been included, which simplifies the process considerably. This is your go-to method for creating a quick and straightforward visualization.
The process involves three main steps:
- Arrange your data: List your categories (Start, Source 1, Use 1, End, etc.) and their corresponding values in two columns.
- Insert the chart: Select your data and choose the Waterfall chart type from the "Insert" tab.
- Set totals: By default, Excel treats all items as changes. You must manually designate the start and end points as "Totals" so they are grounded on the axis.
This video from The Finance Storyteller provides a concise walkthrough of this modern method, as well as the older, more manual stacked-column approach.
How to create a waterfall chart in Excel
This video, 'How to create a waterfall chart in Excel', demonstrates both the modern built-in chart and the older stacked-column method. We will focus on the modern approach.
Please watch the section from 04:04 to 07:05. Pay attention to how the data is set up in a simple two-column format and the critical step of right-clicking the start and end bars to 'Set as Total'.
The built-in chart is fast and convenient. However, it offers limited customization and can sometimes behave unexpectedly, especially with charts that have negative starting or ending values. For a high-stakes presentation where precision and complete control are required, you need a more robust method.
3. Method 2: The Professional's Method (Building from Scratch)
To gain full control over every element of your waterfall chart—colors, connectors, data labels, and behavior with negative values—top analysts often build them from scratch using a combination of other chart types. This is an advanced technique that demonstrates deep Excel mastery, aligning with your goal of achieving "Ivy League quality" skills.
While it's more complex, understanding this method will empower you to create flawless, presentation-ready charts for any scenario. The core idea is to combine several clever tricks:
- Foundation: Use a line chart with up/down bars to create the floating "bricks." This is counter-intuitive but provides the flexibility needed for values to cross the zero axis.
- Connectors: Use formatted error bars on a separate data series to create the thin lines connecting the bricks.
- Data Labels: Use an invisible scatter plot (XY) series to precisely position the data labels above or below the bricks, independent of the brick's actual value.
The following video from Leila Gharani is an outstanding, step-by-step masterclass on this technique. You will follow along to build a fully flexible waterfall chart. This is the main hands-on activity for this lesson.
Easiest Excel Waterfall Chart (Bridge graph) from Scratch - Works with minus values
This video, 'Easiest Excel Waterfall Chart (Bridge graph) from Scratch', is a detailed guide to building a professional-grade waterfall chart. It will take you from data setup to the final cosmetic touches.
Please watch this video from start to finish (approx. 33 minutes). I recommend having Excel open to follow along and build the chart yourself. The video is structured as follows: Overview (00:00 - 04:54): Introduction to the techniques you will use (up/down bars, error bars, scatter plot for labels). Data Preparation (14:39 - 19:16): Setting up the helper columns ('Start', 'End', 'Before', 'After') that will drive the chart. Chart Construction (19:16 - 32:54): The step-by-step process of inserting the chart, adding the different series, and formatting each element to achieve the final look. Take your time with this video. The techniques are advanced, but mastering them will significantly elevate your Excel skills.
The process you just learned is complex, but it's built on a logical foundation. The hardest part is setting up the "helper" data table correctly. Let's test your understanding of that core logic.
Test your understanding!
You are building a cash waterfall chart to show the change in cash from 2023 to 2024. You have the following data:
| Category | Delta |
|---|---|
| Cash 2023 | 500 |
| Cash from Ops | 150 |
| Capex | -80 |
| Asset Sale | 40 |
| Debt Repayment | -100 |
| Cash 2024 | 510 |
Following the from-scratch method shown in the video, what would the values be in the Before, After, and Data Label Position helper columns for the "Capex" row?
Show answer
Let's trace the logic:
-
BeforeCapex: The cash level before the capex occurred is the starting cash (500) plus the Cash from Ops (150).Before= 500 + 150 = 650
-
AfterCapex: The cash level after the capex occurred is theBeforevalue minus the Capex.After= 650 - 80 = 570
-
Data Label Position: The formula for this isIF(Delta < 0, Before, After). We want the label to appear on top of the bar. Since Capex is a negative change (a "down" bar), the top of the bar is at theBeforelevel.IF(-80 < 0, 650, 570)→ The result is 650. The data label for Capex (-80) will be placed at a height of 650.
Conclusion
Today you've added a powerful data visualization tool to your FP&A toolkit. You've seen how to create waterfall charts to tell a clear and compelling story about cash flow movements.
Key Takeaways:
- A waterfall chart (or bridge chart) is the ideal way to visualize how a series of positive and negative changes (sources and uses) impact a starting value to arrive at an ending value.
- For quick and simple charts, Excel's built-in waterfall chart is an effective tool, but you must remember to "Set as Total" for your start and end points.
- For maximum flexibility, control, and a professional finish, building a waterfall chart from scratch using a combination of line, scatter, and bar chart features is a superior method practiced by expert modelers.
Preview of the Next Lesson:
We have now modeled how cash flows through the business and how to visualize those flows. A major use of these outputs (like Debt and EBITDA) is to monitor financial health against lender requirements. In the next lesson, we will learn how to incorporate and test debt covenant compliance checks (e.g., Debt/EBITDA, Interest Coverage) within a financial model. This is a critical risk-management function within FP&A.