Hello! Welcome back to our final lesson in the "Excel Foundations" module.
In our last lesson, we focused on the "backend" of our dashboard, ensuring data integrity by designing a user-friendly data entry sheet with Excel Tables and Data Validation. This guarantees that we have clean, consistent data to work with—the essential foundation for any reliable financial analysis.
Today, we shift our focus to the "frontend." We're going to design the visual layout of your main dashboard. The goal for this lesson is to apply visual design principles like color and hierarchy to a dashboard layout. Think of this as creating the beautiful, intuitive "shell" or "mock-up" of your dashboard. We'll design the structure and style before we wire it up with live data, a common practice that helps create a more thoughtful and effective final product.
Why Good Design Matters
A well-designed dashboard does more than just look good. It communicates information clearly, guides your attention to what's most important, and helps you make better financial decisions at a glance. Your 5 years of experience in personal finance have given you a deep understanding of the key metrics; good design will make those metrics shine.
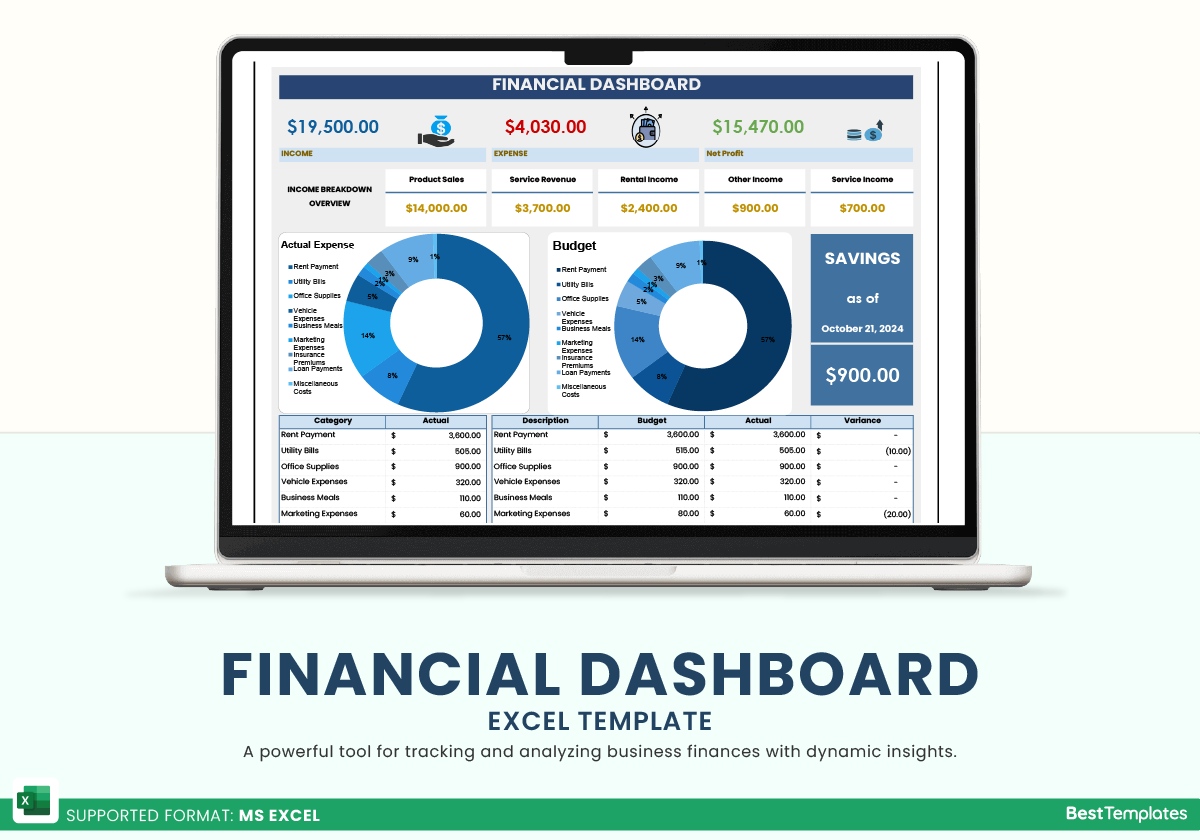
Let's look at an example of a clean, effective financial dashboard built in Excel.
Part 1: Core Principles of Effective Dashboard Design
Before we jump into Excel, let's cover a few fundamental principles that separate a great dashboard from a confusing one.
Effective Dashboard Design: Principles, Best Practices, ...
The article 'Effective Dashboard Design' from DataCamp provides an excellent overview of the core principles we'll be using. It explains how structure, layout, and color are the keys to a scannable and actionable dashboard.
Please read the section 'Core Dashboard Design Principles and Visual Hierarchy'. Focus on the concepts of Visual hierarchy (the Z-scan and inverted pyramid models), Layout (grids and grouping), and Colors (using color as a signal).
To summarize the key ideas from that reading and add a couple more:

-
Visual Hierarchy: The most important information should be the most visually prominent. We achieve this through:
- Position: People in Western cultures tend to read in a Z-pattern, so the top-left is prime real estate. This is where your most critical Key Performance Indicator (KPI), like Net Worth, should go.
- Size & Scale: Larger elements draw more attention. Your main KPIs should be larger than secondary details.
- The Inverted Pyramid: Place high-level summaries (KPIs) at the top, trends and comparisons in the middle, and granular details at the bottom.
-
Layout & Whitespace: A clean, organized layout makes your dashboard trustworthy and easy to read.
- Use a simple grid to align your charts and KPI boxes.
- Use whitespace (empty space) to separate different sections. This is more effective than drawing lines everywhere.
-
Color Strategy: Color should be used purposefully, not just for decoration.
- Limited Palette: Stick to 2-3 main colors. A common strategy is to use neutral colors (like gray and white) for the background and structure, a primary "brand" color (like blue) for titles and accents, and reserved colors for signals (e.g., green for positive variance, red for negative).
- Consistency: If "Income" is represented by blue in one chart, it should be blue in all charts. This reduces the mental effort required to understand the data.
-
Simplicity (Avoiding "Chart Junk"): Every element on your dashboard should have a purpose. Remove anything that distracts from the data itself.
5 Dashboard Design Tips - COMMON MISTAKES to avoid!
The video '5 Dashboard Design Tips' provides an excellent visual demonstration of removing 'chart junk' to create a cleaner, more professional look.
Watch from the beginning to 03:21. Pay close attention to the 'before' and 'after' as the presenter removes redundant labels, gridlines, heavy borders, and distracting background effects. This is a powerful illustration of the 'less is more' principle.
Part 2: Mocking Up Your Dashboard in Excel
Now, let's apply these principles by building the visual mock-up of your dashboard. We'll create the structure for your main KPIs.
How to Build a KILLER Financial Dashboard (Free Template)
The video 'How to Build a KILLER Financial Dashboard' shows a great step-by-step process for mocking up the 'front end' before connecting the data. We'll follow a similar process.
First, watch from 01:11 to 02:22 to understand the design philosophy of separating the front end and back end. Then, watch from 02:22 to 05:05 to see how the presenter mocks up the layout, including setting column widths, merging cells, and applying colors and fonts to create KPI boxes. You don't need to copy the exact specs, but focus on the technique.
Let's build this in your own Excel file.
-
Create and Prepare Your Dashboard Sheet:
- Create a new worksheet and name it Dashboard.
- Go to the View tab and uncheck Gridlines. This immediately makes the sheet look less like a spreadsheet and more like a canvas.
- (Optional) Set a background color for the entire sheet. Select all cells (
Ctrl+A) and choose a light, neutral fill color like a very light gray.
-
Create the Layout Structure:
- As shown in the video, create a basic grid using column widths. A common technique is to have narrow columns for spacing and wider columns for content.
- For example, make column
Aand columnOnarrow (e.g., width 2). Then make columnsBthroughNa medium width (e.g., width 10). This creates a centered container for your dashboard.
-
Mock-Up Your First KPI Card:
- We'll create a card for "Net Worth." Pick a block of cells, for example,
B3:D6. - Title: Merge cells
B3:D3. Type "Net Worth" and format it (e.g., Font: Segoe UI, Size: 14, Bold, Text Color: a dark blue). Center the text. - Value: Merge cells
B4:D5. Type a placeholder value like$50,000. Format this to be the most prominent element (e.g., Font: Segoe UI Semibold, Size: 24). Center the text. - Variance/Comparison: Merge cells
B6:D6. Type a placeholder like+ $1,500 vs. last month. Format this to be smaller and lighter (e.g., Font Size: 10, Text Color: gray). - Borders & Fill: Select the entire block (
B3:D6). Give it a white fill color and a light gray outline to make it look like a distinct card.
- We'll create a card for "Net Worth." Pick a block of cells, for example,
-
Replicate for Other KPIs:
- Once you have a design you like, simply copy and paste this block of cells to create other KPI cards for metrics you want to track (e.g., Total Investments, Monthly Net Cash Flow, Savings Rate).
- Place these cards along the top of your dashboard to follow the "inverted pyramid" principle.
Test your understanding!
You decide to add a KPI card for "Total Debt." Based on the principle of visual hierarchy, where should this card be placed relative to "Net Worth" and "Total Investments," and how might you use color to signal its nature?
Show answer
According to the inverted pyramid and Z-scan patterns, the most important summary metrics go at the top. Since "Total Debt" is a primary component of "Net Worth," it belongs in the top row alongside "Net Worth" and "Total Investments."
For color, while you might be tempted to make it red because debt is "bad," it's better to maintain a consistent design for all KPI cards. The value itself or its change can be colored later using conditional formatting. For the mock-up, the title and structure should be consistent with the other cards to maintain a clean, balanced look.
Part 3: Advanced Formatting for a Professional Finish
To make your dashboard truly dynamic and easy to read, we can use some of Excel's powerful formatting features. We won't connect them to real data yet, but it's important to know how they work as we design.
Custom Number Formatting
This allows you to change how a number looks without changing its underlying value. It's perfect for adding symbols or text. For example, we can make positive numbers show an up arrow and negative numbers a down arrow.
How to Build a KILLER Financial Dashboard (Free Template)
Let's return to the 'KILLER Financial Dashboard' video to see exactly how to implement this.
Watch from 12:30 to 13:56. The presenter explains how to open the 'Format Cells' dialog (Ctrl+1) and use a custom format string to display up/down triangles based on whether the value is positive or negative. This is an extremely useful technique for variance indicators.
The format string for this looks something like this: ▲ #,##0; ▼ #,##0; -
This tells Excel:
- If the number is positive, show an up triangle and the number.
- If the number is negative, show a down triangle and the number.
- If the number is zero, show a dash.
Conditional Formatting
This is even more powerful. It automatically applies formatting (like cell color or font color) based on a rule. This is how you can make a negative cash flow value automatically turn red.
How to Build a KILLER Financial Dashboard (Free Template)
The same video provides a clear walkthrough of setting up conditional formatting.
Watch from 13:56 to 17:49. This section demonstrates how to create rules that color a cell green if the value is greater than zero and red if it's less. It also introduces an advanced trick of basing the format on a different cell, which will be useful later.
As you build your dashboard, think about where you can apply these rules. For example:
- The Net Cash Flow KPI value could turn red if it's negative.
- A Budget vs. Actual variance could turn red if you've overspent.
Conclusion
Congratulations! You've just designed the visual foundation of your personal finance dashboard. While it's just a static mock-up for now, you've made critical decisions about layout, hierarchy, and color that will make your final dashboard intuitive and powerful.
Key Takeaways:
- Design comes first: Mocking up the layout before adding data leads to a better end product.
- Follow core principles: A clear hierarchy, clean layout, purposeful color, and simplicity are key to effective dashboard design.
- Excel is a powerful design tool: By hiding gridlines, managing column widths, and using fill colors and borders, you can create a professional-looking interface.
- Advanced formatting adds dynamism: Custom Number Formatting and Conditional Formatting are essential tools for making your data communicate its meaning at a glance.
In our next module, "Tracking Expenses and Income," we'll start bringing this dashboard to life. We will begin by creating the detailed data entry tables for all your income and expense transactions and then write our first SUMIFS formulas to aggregate the data. These are the calculations that will eventually feed the beautiful KPI cards you designed today.