Welcome back to the final module! In our previous lesson, you created a detailed runbook for the capstone project. That document answered the crucial question: "How do we operate this system?" Now, we will address an equally important question: "What is this system?"
This lesson is dedicated to the art and science of architectural diagramming. While your runbook provides a low-level, procedural view for operators, architectural diagrams offer a high-level, structural view for developers, architects, and product managers. A good diagram is a powerful communication tool that can explain a complex system in seconds. Your ability to create and interpret these diagrams is essential for designing scalable systems and collaborating effectively, directly supporting the Infilect job description's expectations for an engineer who "designs and develops REST APIs" and "builds scalable backend/cloud applications."
By the end of this lesson, you will create and understand the key architectural diagrams for your capstone project, providing a clear visual map of the entire system you've built.
1. The Power of a Good Diagram
Most software architecture diagrams you find online are, frankly, not very useful. They are often a confusing mess of boxes and lines with no clear meaning. The goal of a good diagram is not to be a piece of art, but a clear, unambiguous map of a software system.
Visualising software architecture with the C4 model - Simon Brown, Agile on the Beach 2019
To understand why so many diagrams fail and how we can do better, let's watch the beginning of a classic talk by Simon Brown, the creator of the C4 model. He brilliantly captures the problem we're trying to solve.
Watch the first twelve minutes of the talk, from the introduction up to where he begins explaining the first diagram. Pay attention to his core idea: thinking of diagrams as maps that you can zoom in and out of to get different levels of detail for different audiences.
The key insight is that a single diagram cannot tell the whole story. We need a set of diagrams, or "maps," at different levels of abstraction. This is where the C4 model comes in.
2. The C4 Model: A Set of Maps for Your Code
The C4 model provides a simple, hierarchical way to visualize software architecture at four different levels of detail: Context, Containers, Components, and Code. It's a way to create a set of maps that can explain your system to both technical and non-technical audiences.
C4 Model Tutorial - Complete Beginner's Guide
This article from Visual C4 provides a concise overview of the C4 model and its principles.
First, read the section What is the C4 Model? to understand the four levels. Then, jump to the end and read the sections Common Mistakes and Advanced Tips. This will give you a solid framework for creating effective diagrams.
For our purposes, we will focus on the first two, and most important, levels: System Context and Containers.
Level 1: System Context Diagram (The Big Picture)
The System Context diagram is the highest level of abstraction. It shows your system as a single black box and illustrates how it interacts with its users (people) and other external systems. This diagram is perfect for setting the scene and explaining your project to someone who has no prior knowledge, like a product manager or a new team member.
Visualising software architecture with the C4 model - Simon Brown, Agile on the Beach 2019
Let's return to Simon Brown's talk, where he explains how to create a System Context diagram.
Watch the segment from level 1. Notice how simple it is: just your system, the users, and the external dependencies.
For our capstone project, the "Retail Shelf Intelligence Backend," a System Context diagram would show:
- Users: The
Backend Developer(who pushes code) and perhaps aData Annotator(who uses the system to label images). - Our System: The
Retail Shelf Intelligence API. - External Systems:
GitHub(where the code is hosted) and theAWS Cloudenvironment.
Level 2: Container Diagram (The Backend Engineer's View)
This is the most important diagram for you as a backend engineer. The Container diagram "zooms in" to the system box from the context diagram and shows the high-level, deployable/runnable pieces that make up your application.
Important Note: In the C4 model, a "container" is not just a Docker container. It's a broader term for an application or a data store. For example, your Django application is a container, and your PostgreSQL database is another container.
Visualising software architecture with the C4 model - Simon Brown, Agile on the Beach 2019
Simon Brown's explanation of the Container diagram is crucial. This is the view that shows technology choices and high-level structure.
Watch the section on the Container diagram. Pay close attention to how he breaks down the internet banking system into a web app, a mobile app, an API, and a database. This is exactly what we will do for our capstone.
For our capstone, the "containers" are:
- A Web Application (our Django/Gunicorn app serving the API)
- An Asynchronous Worker (our Celery app processing tasks)
- A Relational Database (PostgreSQL on AWS RDS for structured data)
- A Message Broker / Cache (Redis for Celery tasks and caching)
- Object Storage (AWS S3 for storing images)
- A Load Balancer (AWS ALB distributing traffic)
This diagram clearly communicates the major technology choices and the overall architecture. It's the blueprint of your system. You can see a fantastic real-world example of a similar architecture in the article below.
Orchestrating AI: Event-Driven Architectures for Complex AI Workflows - The New Stack
This article from The New Stack describes an event-driven architecture for an AI video processing system. The architecture is remarkably similar to our capstone project.
Focus on the two diagrams in the article. First, look at the high-level process flow under the heading Implementing EDA. Then, scroll down to the more detailed architecture diagram just above the heading "Django: API Service". This diagram, titled "Workflow of Gcore Streaming Platform AI subtitle generation", is an excellent example of a C4-style Container diagram. It shows the API, the queue (Redis), and the workers (Celery), just like our system.
Here is another professional example of a detailed cloud architecture diagram. Notice how it shows the flow of requests from the user through the load balancer to the application instances and backend services. This is the level of detail a Container diagram aims to capture.
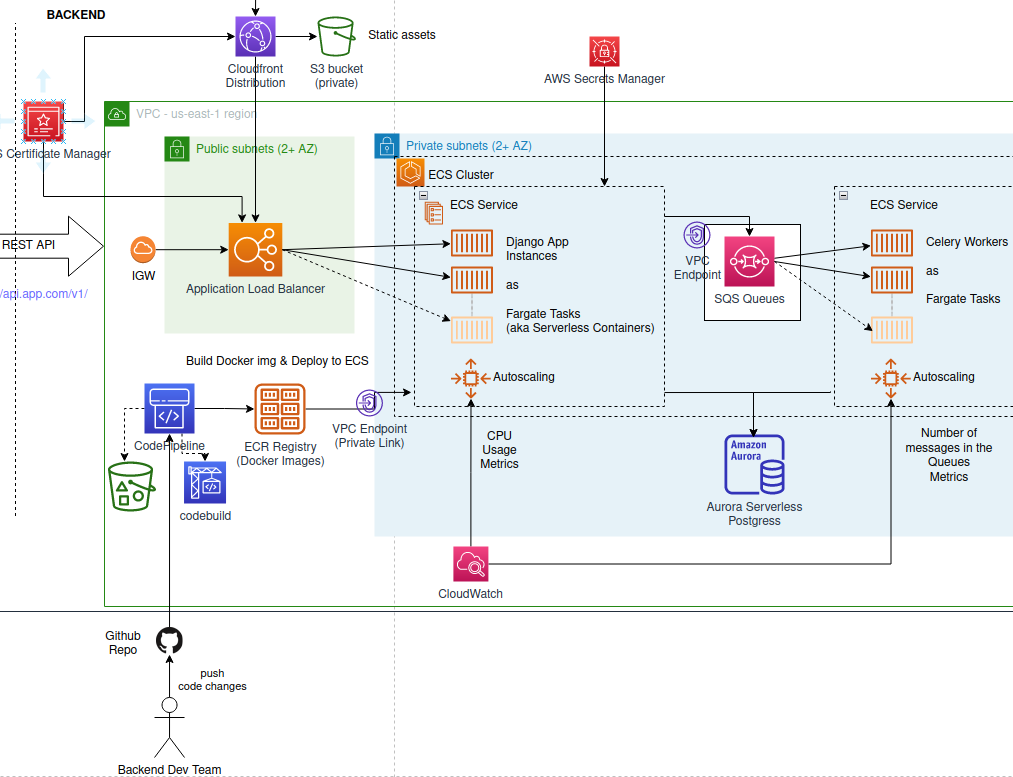
3. Tools for Diagramming
You can draw diagrams with many tools, but for engineers, the "Diagrams as Code" approach is particularly powerful. This involves writing simple text or code that generates the diagram. The benefit is that your diagrams can be version-controlled in Git, just like the rest of your code.
Top 6 Tools to Turn Code into Beautiful Diagrams
This ByteByteGo video provides a quick tour of several popular "diagrams as code" tools.
Watch the overview of the first three tools: Diagrams: A Python library, which is a great choice for Python developers. Mermaid: A simple, Markdown-like syntax that is supported directly by GitHub, GitLab, and many other tools. PlantUML: A more powerful and complex tool. For today's task, we'll use Mermaid because of its simplicity and excellent integration with platforms like GitHub.
4. Hands-On Task: Diagram Your Capstone Project
Your task is to create the System Context and Container diagrams for the "Retail Shelf Intelligence Backend" project using Mermaid. You will add these to a new ARCHITECTURE.md file in your project's root directory.
- Create a new file named
ARCHITECTURE.mdin the root of your capstone project repository. - Copy the entire Markdown block below (including the text and the code blocks) into your new
ARCHITECTURE.mdfile. - The Mermaid code blocks contain placeholders like
[Description of interaction]. Your job is to replace these placeholders with accurate descriptions of how the components in your project interact. Study the syntax and the examples to guide you. - Commit and push the
ARCHITECTURE.mdfile to your GitHub repository. When you view this file on GitHub, it will automatically render the code into beautiful diagrams.
ARCHITECTURE TEMPLATE
# Architecture: Retail Shelf Intelligence Backend

This document outlines the architecture of the Retail Shelf Intelligence Backend project using the C4 model for visualizing software architecture.


## Level 1: System Context

The System Context diagram provides a high-level view of the system, its users, and its interactions with external systems. It shows the project as a single black box in its environment.

```mermaid
graph TD
    subgraph "Retail Shelf Intelligence System"
        direction LR
        system(Retail Shelf<br/>Intelligence<br/>Backend)
    end

    subgraph "Users"
        direction LR
        dev[Backend<br/>Developer]
        annotator[Data<br/>Annotator]
    end

    subgraph "External Systems"
        direction LR
        github[GitHub]
    end

    dev -- "Pushes code to" --> github
    github -- "Triggers deployments to" --> system
    annotator -- "[Description of interaction]" --> system
```


## Level 2: Container Diagram

The Container diagram zooms into the system to show the main, high-level, deployable building blocks (containers) and their interactions. A "container" here refers to an application or a data store. This diagram illustrates the key technology choices and the overall shape of the architecture.

```mermaid
graph TD
    subgraph "User"
        user[Data Annotator / API Client]
    end

    subgraph "AWS Cloud"
        direction TB

        subgraph "Network"
            alb(Application<br/>Load Balancer)
        end

        subgraph "Application"
            direction LR
            web(<b>Web Application</b><br/>Django + Gunicorn<br/>Serves REST API)
            worker(<b>Async Worker</b><br/>Celery<br/>Processes ML tasks)
        end

        subgraph "Data & Messaging"
            direction LR
            db[(<b>Database</b><br/>PostgreSQL on RDS<br/>Stores metadata)]
            s3[(<b>Object Storage</b><br/>AWS S3<br/>Stores images)]
            redis[(<b>Broker / Cache</b><br/>Redis<br/>Task queue & caching)]
        end
    end

    user -- "HTTPS API Requests" --> alb
    alb -- "Forwards traffic to" --> web

    web -- "[Description of interaction]" --> db
    web -- "[Description of interaction]" --> s3
    web -- "[Description of interaction]" --> redis

    worker -- "[Description of interaction]" --> db
    worker -- "[Description of interaction]" --> s3
    redis -- "[Description of interaction]" --> worker
```
Conclusion
Congratulations! You have now documented your system from two critical perspectives. The runbook from the last lesson describes the process of managing the system, while the architectural diagrams you just created describe its structure. Together, they form a professional documentation package that makes your system understandable, maintainable, and scalable.
Key Takeaways:
- Architectural diagrams are communication tools, first and foremost.
- The C4 model provides a structured way to create diagrams at different levels of detail (Context, Containers, Components, Code).
- The Container diagram is the most important blueprint for a backend engineer, showing the high-level technology choices and runtime components.
- "Diagrams as Code" tools like Mermaid allow you to version-control your architecture alongside your source code.
In our final lesson, you will learn how to synthesize everything you've built—the project features, the runbook, and these diagrams—into a compelling presentation. This will prepare you to confidently showcase your capstone project and your skills in a technical interview.