Hello and welcome to your first lesson in our data visualization course.
Today, we'll start by building a solid foundation for everything that follows. Your goal is to create beautiful, insightful charts, and the key to that is understanding the underlying structure of a Matplotlib plot. We will focus on the "theory first" approach you prefer, dissecting a chart into its fundamental components.
By the end of this lesson, you will be able to distinguish between the four core concepts in Matplotlib's object hierarchy: the Figure, the Axes, the Axis, and the Artist. This knowledge is the single most important prerequisite for gaining full control over your visualizations and moving beyond basic, inflexible plots.
The Anatomy of a Plot
Think of creating a chart like painting. You start with a blank canvas, decide where to place your drawings, add the drawings themselves, and then embellish them with details like titles and labels. Matplotlib uses a similar structure.
To get a quick overview of these concepts, let's watch a short segment from a tutorial by Tech With Tim.
Learn Matplotlib in 30 Minutes - Python Matplotlib Tutorial
This video provides a great analogy for the main components of a Matplotlib plot.
Watch the clip from the beginning. The speaker introduces the concepts of Figure, Axes (the plot area), and Axis (the x- and y-axis) using the analogy of a page and the graphs drawn on it.
As the video explains, we have three initial key terms:
- Figure: The entire window or page. It's the top-level container for everything.
- Axes: The actual plot or graph where you draw your data. A single Figure can contain multiple Axes.
- Axis: The number-line-like objects that define the data range, with ticks and labels. These are the x-axis and y-axis you're familiar with.
It's crucial to note the distinction between Axes (ending in 'es'), which refers to the plotting area, and Axis (ending in 'is'), which refers to one of the dimensional axes. This is a common point of confusion for beginners, so it's worth remembering.
Now, let's look at a diagram that puts these pieces together. This is the official "Anatomy of a figure" from the Matplotlib documentation.
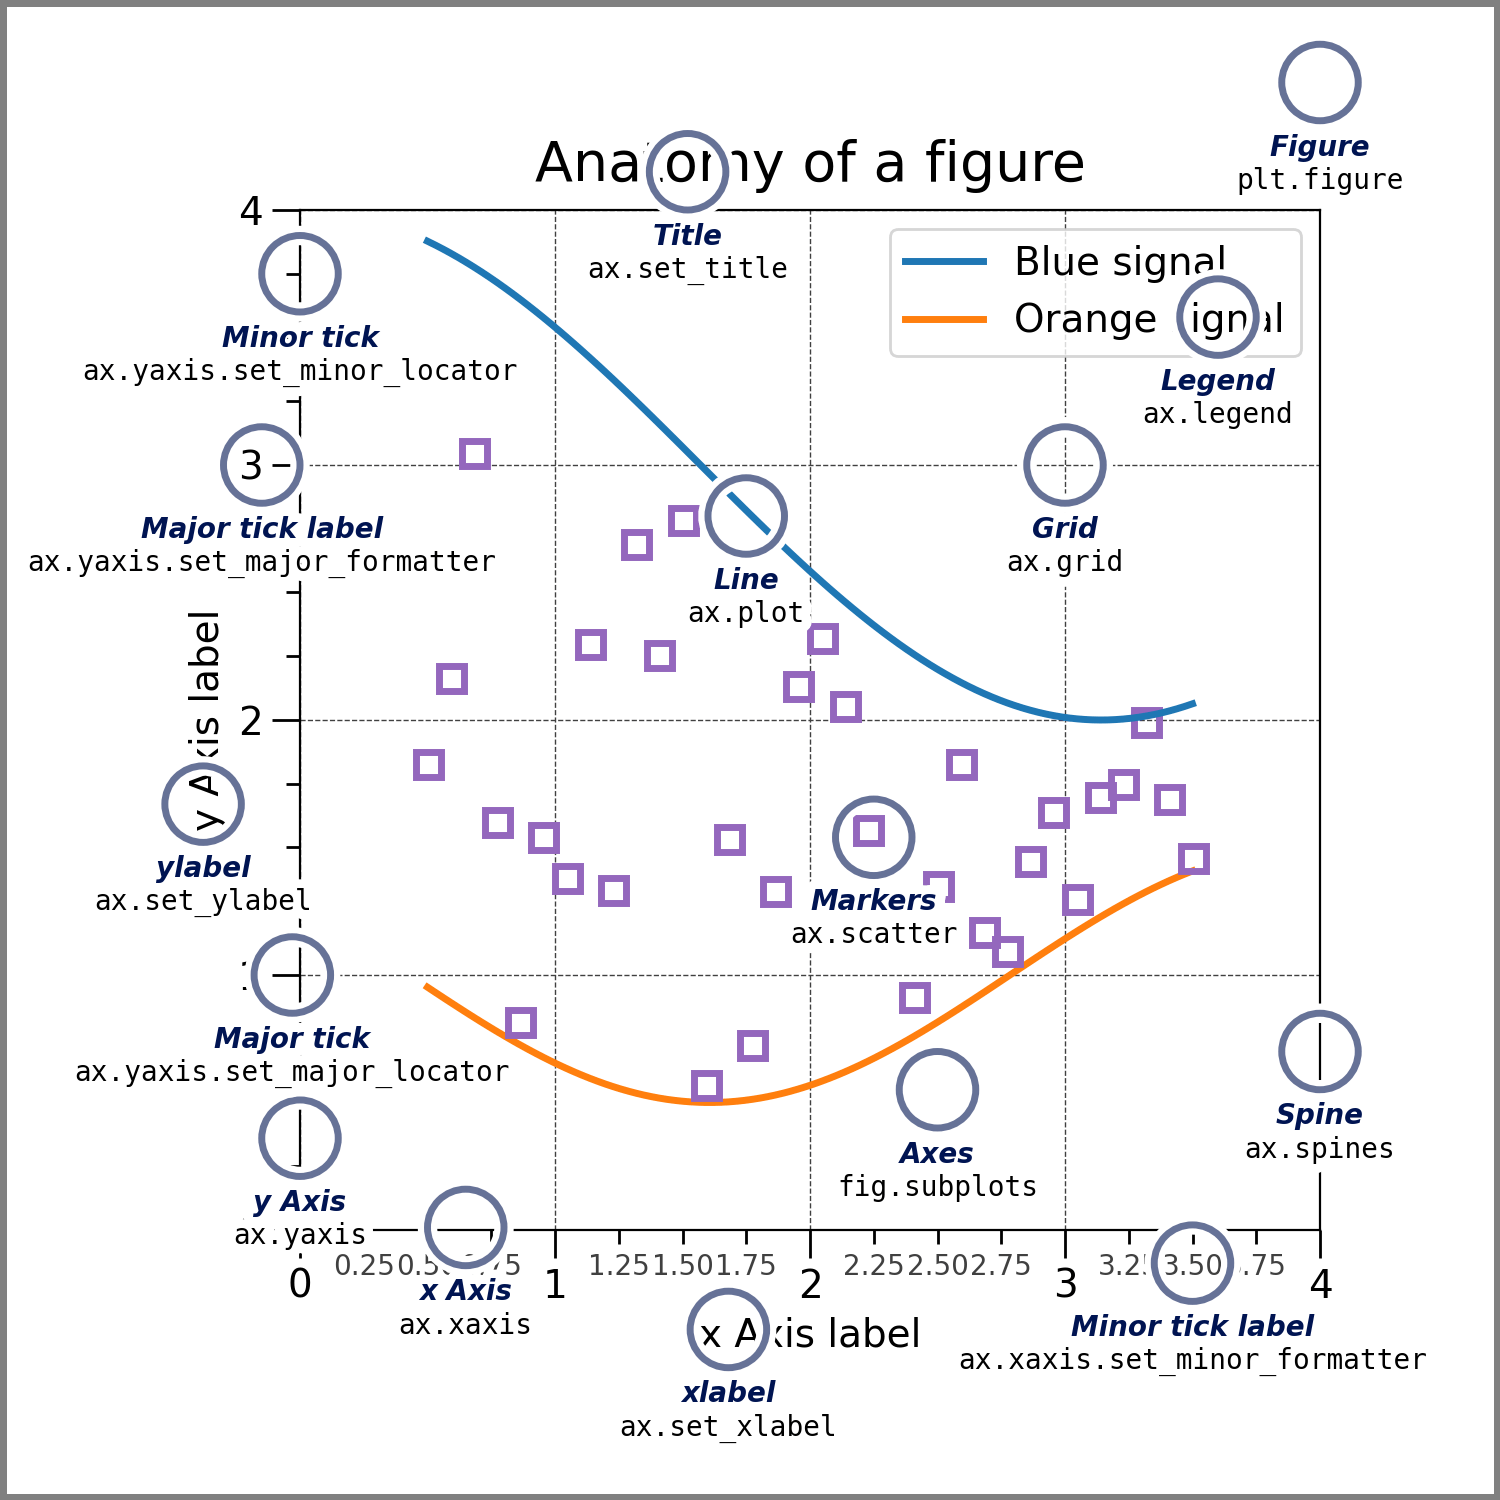
This diagram gives us a visual map. You can see the Figure as the whole image. The main rectangular area with the grid is the Axes. The horizontal and vertical lines with tick marks at the bottom and left are the x-Axis and y-Axis.
To solidify this, let's read the formal definitions from Matplotlib's official documentation.
Quick start guide — Matplotlib 3.10.8 documentation
This guide provides precise definitions for the components we've just discussed.
Please read the section "Parts of a Figure". Focus on the definitions for Figure, Axes, and Axis. Pay close attention to how each part is described as containing other parts.
The Artist: The Secret to Everything
So far, we have the container (Figure), the plot area (Axes), and the scales (Axis). But what about the lines, the points, the text, the labels, and the legend?
In Matplotlib, there's a unifying concept for all of this: the Artist.
Basically, everything you see on the figure is an Artist. This includes the Figure, Axes, and Axis objects themselves, as well as all the smaller elements like text, lines, and markers. Artists are the objects that actually handle the drawing onto the canvas.
This creates a clear hierarchy, which can be visualized as a tree.
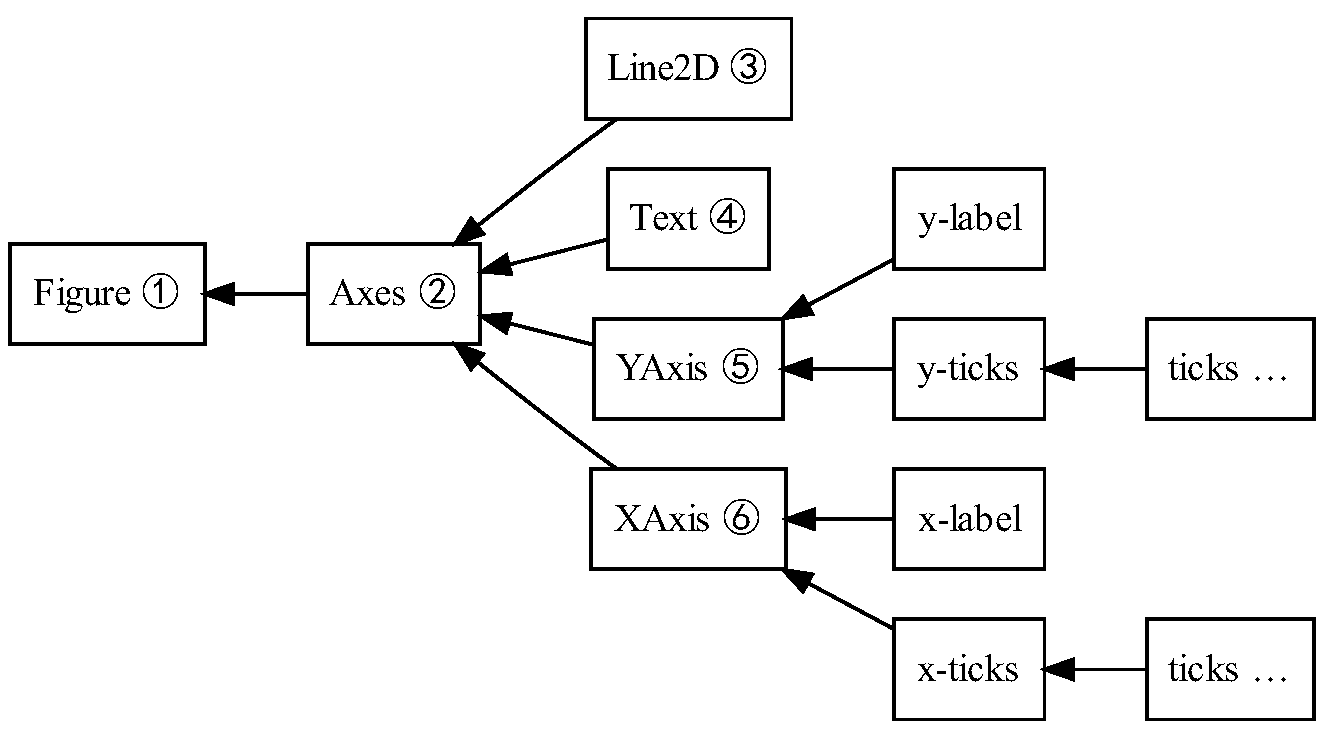
This hierarchical structure is powerful. Since every element is a Python object, you can access and modify it. This is how you'll achieve the fine-grained control needed to "beautify" your charts later on.
Let's read the official definition for the Artist object to complete our theoretical model.
Quick start guide — Matplotlib 3.10.8 documentation
This section defines the all-encompassing Artist object.
In the same guide as before, read the short definition for Artist. Note the key phrase: "Most Artists are tied to an Axes".
This idea that almost everything is an Artist contained within an Axes is the core principle of Matplotlib's object-oriented approach. To see how this plays out in code, take a look at the following snippet from the Real Python guide. You don't need to understand every detail, but notice how it's possible to "walk" down the object tree to access a specific element.
one_tick = fig.axes[0].yaxis.get_major_ticks()[0]
Here, we start from the Figure (fig), get its first Axes object (.axes[0]), access its y-Axis (.yaxis), get its major ticks, and grab the first Tick object. This demonstrates that the hierarchy we've been discussing is directly reflected in the code we will write.
From Theory to Practice: The Object-Oriented Way
So, how do we use this knowledge? Matplotlib offers two ways to create plots: a simple "stateful" or "procedural" interface and a more powerful "object-oriented" interface. Since your goal involves creating complex, customized charts, we will focus almost exclusively on the object-oriented approach.
This approach involves explicitly creating Figure and Axes objects and then calling methods on them. This gives you full control, as you always have a reference to the specific part of the plot you want to change.
To understand why this is so important, please watch the following video. It does an excellent job of explaining the two approaches and why choosing the right one is critical.
11- Procedural vs. Object-Oriented Plotting in Matplotlib
This video clearly explains the two main ways of plotting in Matplotlib and introduces the object-oriented syntax we will be using throughout this course.
Please watch these two segments: First, watch the introduction from the beginning, where the instructor explains why it's important to understand the two different plotting styles. Next, watch the section on the object-oriented approach from this timestamp. Pay close attention to the line fig, ax = plt.subplots(). This is the command you will use to create your Figure (fig) and Axes (ax) objects.
The key takeaway is that the command fig, ax = plt.subplots() is our entry point. It creates and returns the two most important objects we've learned about today: the Figure container (fig) and the Axes plotting area (ax). From here, we can use our ax variable to draw data and customize nearly every Artist within it.
Key Takeaways
In this lesson, we've unpacked the core structure of a Matplotlib visualization. You should now be able to distinguish between its fundamental components:
- Figure: The top-level canvas for the entire output.
- Axes: The individual plot or chart area where data is displayed. This is where most of your work will happen.
- Axis: The objects representing the x and y axes, responsible for scales, ticks, and tick labels.
- Artist: The base class for everything rendered on the
Figure, from theAxesandAxisobjects to lines, text, and patches.
Understanding this object hierarchy is the first and most crucial step toward mastering Matplotlib.
What's Next?
In our next lesson, we will put this theory into practice. We'll move from defining these objects to actively using them. You will learn how to create your first plots using the object-oriented API, directly manipulating the Figure and Axes objects to build and customize charts.