Introduction
In our last lesson, we dissected a full-scale outage by reconstructing a precise timeline of events. We saw how to pivot from metrics to traces to logs to move from symptom to root cause. Now, we'll shift our focus from a system that is broken to a system that is slow—a far more common and often more challenging problem in large-scale engineering.
This lesson is designed to help you master the learning outcome: Apply diagnostic techniques to pinpoint the root cause of a performance bottleneck in a given scenario. We will investigate a "tail latency" problem, where the system is fast for most users but unacceptably slow for a critical few. As a Principal Engineer, diagnosing these subtle performance degradations is a key responsibility, as they often impact your most valuable customers and reveal deep-seated architectural issues. We will build upon our "Triage, Examine, Diagnose" framework, adding profiling to our toolkit to see where distributed tracing falls short.
Why Tail Latency Matters
Before we dive into the techniques, let's establish why we obsess over the performance for the slowest 1% of requests. Averages can be deceptive; a healthy average latency can easily hide a terrible experience for a minority of users. These users at the tail-end of the latency distribution (e.g., the 99th percentile, or P99) are often not random victims but your most engaged, "power" users, whose complex workflows stress the system in unique ways.
The following video provides an excellent foundation, explaining key performance metrics and why focusing on percentiles is crucial for understanding real-world system behavior.
21.1. Backend Scaling and Performance Engineering: Part-1
This video, "Backend Scaling and Performance Engineering," effectively breaks down the core concepts of latency and throughput.
Please watch the first part of the video covering latency and percentiles, this segment. Pay close attention to the arguments for using P90 and P99 over averages and the insight that requests with the highest latency often correspond to the most complex and valuable business logic.
The Diagnostic Mindset: Measure, Don't Guess
When faced with a performance problem, the instinct of many experienced engineers is to jump to a familiar solution: "It's probably the database, let's add a cache," or "Let's throw more servers at it." This approach is often wasteful and ineffective. The first principle of performance engineering is to measure, don't guess. You must identify the specific bottleneck before attempting a fix.
A mistake, such as implementing a caching layer when the actual bottleneck is a synchronous logging call, can waste weeks of engineering effort with no improvement. The following video segment powerfully illustrates this common pitfall.
21.1. Backend Scaling and Performance Engineering: Part-1
Continuing with the same video, this section introduces the concept of a bottleneck and demonstrates the folly of guessing the cause.
Watch the segment from this point. The example of the /products API, where caching was added fruitlessly before measurement revealed a synchronous logging call was the true culprit, is a critical lesson in diagnostic discipline.
This discipline is formalized in the Google SRE book's troubleshooting methodology. A key technique is to systematically break down the problem by asking a series of questions:
- What is the system doing that it shouldn't be?
- Where in the system is this happening?
- Why is it happening?
This structured inquiry, backed by data, prevents you from chasing red herrings.
Profiling: When Tracing Isn't Enough
In our previous lesson, distributed tracing was our primary tool for finding "where" a problem occurred. Tracing excels at diagnosing I/O-bound bottlenecks—that is, time spent waiting for network calls to other services, databases, or caches.
However, what happens when the time is not spent waiting for I/O, but on computation within a single service? This is a CPU-bound bottleneck. A distributed trace will show a single, long span for the service, but it can't tell you why it's taking so long internally. For that, we need a different tool: profiling.
A profiler attaches to a running process and samples what the code is doing, allowing you to see which specific functions or lines of code are consuming the most CPU time.
21.1. Backend Scaling and Performance Engineering: Part-1
This final segment from the "Backend Scaling" video clearly distinguishes between these two essential diagnostic tools.
Watch the section from Profiling and Tracing. Focus on the distinction it draws: tracing is for I/O-bound tasks (across services), while profiling is for CPU-bound tasks (within a service).
Scenario: The P99 Latency Mystery in RecommenderService
You are the Principal Engineer for an e-commerce platform. The RecommenderService, which generates personalized product recommendations, has an SLO for P99 latency of 500ms. For the last 24 hours, P99 latency has been hovering around 3 seconds, while P50 remains a healthy 80ms. There are no associated errors.
Step 1: Scope with Metrics & Correlate with Change
You start at your metrics dashboard.
- Latency: The P99 latency for
RecommenderServicebegan to degrade sharply 24 hours ago. P50 and P90 are unaffected. - Traffic & Errors: Request volume, CPU utilization, and error rates for the service are all nominal. The system isn't under unusual load.
- Change Log: You check the deployment history. A new recommendation algorithm, part of a "SmarterRecs" feature, was rolled out to 1% of users via a feature flag 24 hours ago.
Analysis: The timing is too perfect to be a coincidence. The problem is almost certainly related to the new "SmarterRecs" feature, affecting only a small subset of requests.
Step 2: Isolate with Traces
Your next step is to examine the requests for the affected user group. You filter your distributed tracing tool for traces that include RecommenderService, have a total duration > 2 seconds, and have the feature_flag: SmarterRecs attribute.
You find thousands of examples. You open one and see a trace timeline like this:
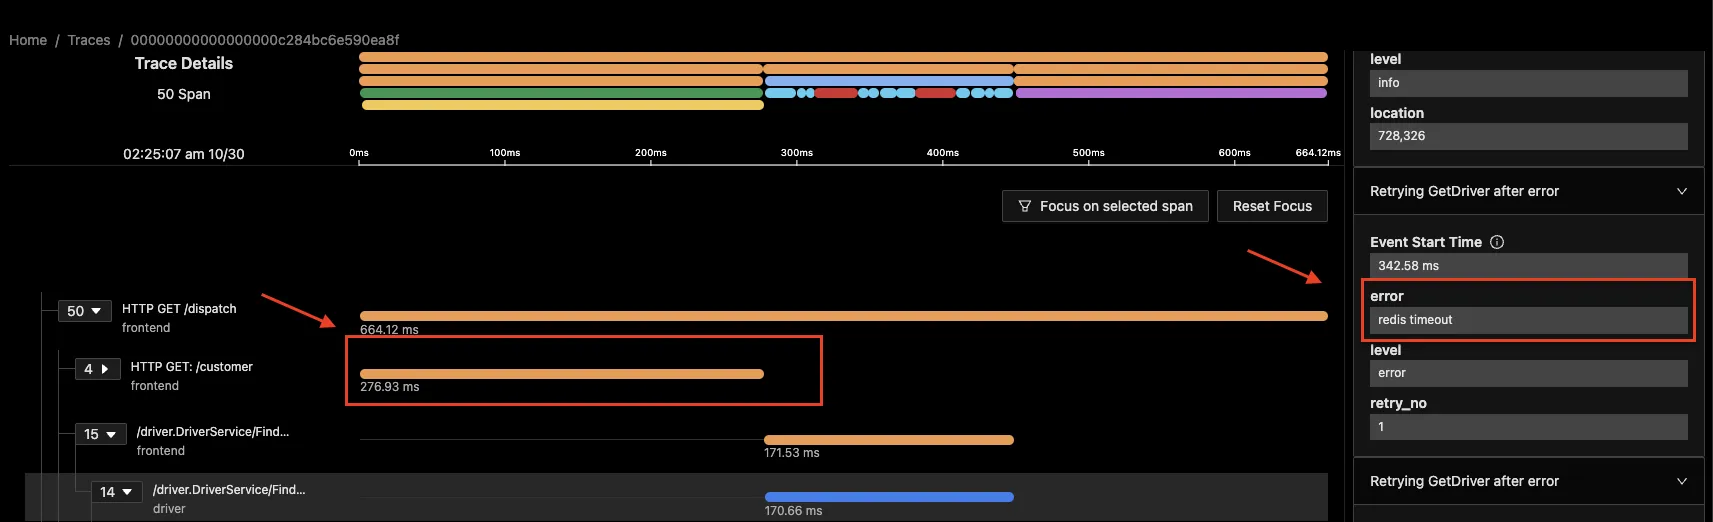
The trace shows the following:
- An API Gateway call (10ms).
- A call to the
RecommenderService(3000ms). This is the problem span. - Nested within that span, you see several very fast calls:
- A call to a Redis cache for user preferences (5ms).
- A call to a database for product metadata (15ms).
Analysis: The trace has successfully told you where the problem is not. It is not in the network calls to the cache or the database. The 3-second latency is happening inside the RecommenderService process itself. Distributed tracing has taken you as far as it can.
Step 3: Pinpoint with a Profiler
Now you need to look inside the RecommenderService process. You deploy a canary instance of the service with a CPU profiler attached and route a portion of the "SmarterRecs" traffic to it. After collecting a few minutes of data from these slow requests, you analyze the profiler's output.
Whether visualized as a flame graph or a "plain list" of hot methods, the result is unambiguous: a single function, generateCollaborativeFilteringMatrix(), is consuming 95% of the CPU time on every slow request.
Step 4: Diagnose the Root Cause
With the profiler pointing to a specific function, you examine the source code. The generateCollaborativeFilteringMatrix() function was added as part of the "SmarterRecs" feature. You discover it contains nested loops that iterate over the user's entire purchase history and compare it against the history of other similar users.
The algorithm has a time complexity of O(n²), where 'n' is the number of items in the user's history.
- For a new user with 10 purchases, the operation is trivial.
- For a typical user with 100 purchases, it's still fast enough.
- But for your 1% "power users"—who have thousands of purchases—the quadratic complexity leads to a computational explosion, causing the 3-second CPU-bound latency.
The bottleneck isn't I/O, it's algorithmic. The fix involves either optimizing the algorithm (e.g., pre-calculating parts of the matrix offline) or placing a bound on the amount of history processed online.
A Real-World Google Case Study
This scenario, while illustrative, is simplified. For a deeper look at a complex, real-world performance investigation at Google, the SRE book provides an exceptional case study involving App Engine. It has remarkable parallels to our exercise: a mysterious latency spike, a misleading initial hypothesis, the use of Dapper to isolate the problem to within an application's process, and a non-obvious root cause related to application logic and data volume.
Troubleshooting Methodology: A Learning Path
This chapter from the Google SRE book details the investigation of a severe performance degradation in an App Engine service. It is a masterclass in systematic diagnosis.
Please read the entire Case Study section, starting from this point. As you read, note the following: The initial (incorrect) theory about merge_join and suboptimal database indexing. How Dapper traces were used to find that latency was high even for static content requests with fast RPCs, proving the bottleneck was inside the application code. The final root cause: a long-standing bug combined with a change in workload (a security scan) bloated an in-memory whitelist, causing every request to become pathologically slow.
This case study perfectly demonstrates that at scale, the most perplexing bottlenecks often lie at the intersection of code, data, and changing workloads, requiring a multi-tool approach that goes beyond basic metrics.
Conclusion
In this lesson, we delved into the art of diagnosing performance bottlenecks, moving beyond simple outages to the subtle but critical issue of tail latency.
Key takeaways from our investigation include:
- Diagnose systematically: Follow a data-driven process from metrics (what) to traces (where) and finally to profiling (why), rather than jumping to conclusions.
- Know your tools' limits: Distributed tracing is essential for I/O-bound issues, but profiling is necessary when the bottleneck is CPU-bound within a single service.
- Think algorithmically: Not all performance problems are about infrastructure. The complexity of your application's own logic can often be the primary source of latency, especially at the tail.
- Correlate with change: Performance degradations are almost always triggered by a change—in code, configuration, or workload. Identifying that change is a critical step in diagnosis.
We have now concluded our module on Observability. You have learned to analyze system failures and performance issues using the same foundational principles and tools used at Google.
In our next lesson, we will begin a new module, The Craft of Principal-Level Design. We will pivot from reacting to problems in existing systems to proactively designing robust, scalable, and resilient systems from the ground up, synthesizing all the concepts we have covered in the course so far.