Hello! Welcome to your fifth lesson in the "Statistical Foundations for Game Balance" module.
In our last lesson, we explored Expected Value (EV), a powerful tool for boiling down complex probabilities into a single number that represents the long-term average outcome of a choice. We saw how EV helps compare different abilities or balance loot drops. That was about understanding the value of one thing.
Now, we'll ask a different but related question: how are two things connected? For instance, does a higher average number of actions per minute (APM) lead to a higher win rate? Is there a relationship between the amount of gold a player mines in the first 10 minutes of an RTS match and their final army size?
Today, you will learn to identify and measure the strength of relationships between game variables (e.g., player spending and win rate) using correlation. This will enable you to move beyond analyzing single metrics and start uncovering the hidden statistical machinery that connects different parts of your game systems.
Understanding Relationships: Direction and Strength
When we look at two variables, we first want to visualize their relationship. The standard tool for this is a scatter plot, where each point represents an individual observation (like a single player or a single match).
A relationship has two key properties:
-
Direction:
- Positive: As one variable increases, the other tends to increase. (e.g., More time played, higher player level).
- Negative: As one variable increases, the other tends to decrease. (e.g., More defensive structures built, fewer successful enemy raids).
- None: The variables show no discernible pattern.
-
Strength: How closely the data points follow a pattern. A tight, clear line indicates a strong relationship; a diffuse, shapeless cloud suggests a weak one.
We quantify this direction and strength using a single number: the correlation coefficient, denoted as . This value always falls between -1 and +1.
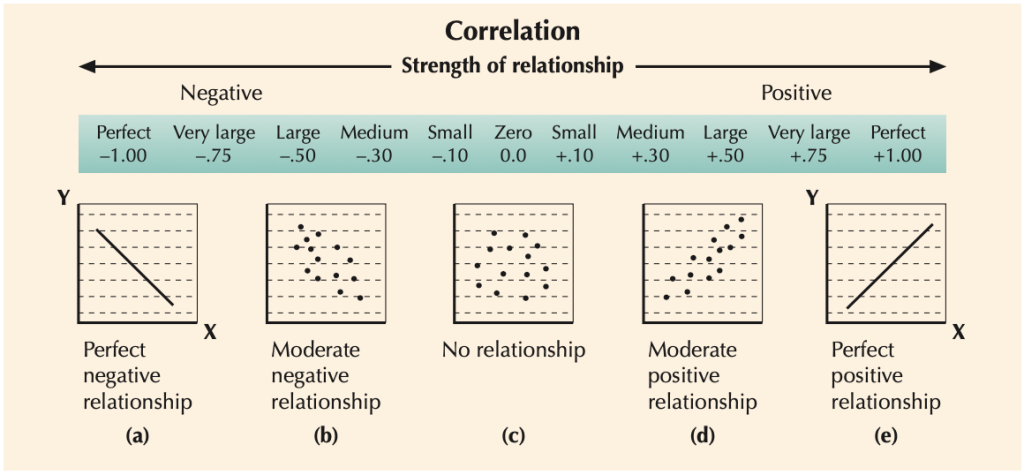
To formalize this a bit, we often distinguish between two types of variables.
- Explanatory Variable (X-axis): The variable we think might be causing or explaining the change (e.g., gold spent on units).
- Response Variable (Y-axis): The variable that measures the outcome (e.g., win rate).
Let's watch a short video to solidify these foundational concepts.
Explanatory and Response Variables, Correlation (2.1)
The video 'Explanatory and Response Variables, Correlation (2.1)' by Simple Learning Pro provides a clear introduction to scatter plots, the roles of explanatory and response variables, and the meaning of the correlation coefficient.
Please watch from the beginning until 04:16. Focus on: The distinction between explanatory and response variables. How the direction (positive/negative) and strength of a relationship are reflected in a scatter plot and the value of r.

Measuring Correlation: Pearson vs. Spearman
Now that we can visually identify a relationship, how do we calculate the value? There are several methods, but two are particularly useful for game design.
1. Pearson's Correlation Coefficient (r)
This is the most common type of correlation. It measures the strength of a linear relationship between two continuous variables (e.g., numbers that can take any value, like damage, health, or time).
The formula looks complex, but its logic is intuitive. It essentially calculates how consistently the two variables vary together from their respective means.
Let's explore the logic and assumptions behind Pearson correlation.
Correlation Analysis - Full Course in 30 min
The video 'Correlation Analysis - Full Course in 30 min' by numiqo offers an excellent breakdown of different correlation types. We'll focus on the most common one first.
Watch the section on Pearson Correlation from 02:14 to 08:31. Pay attention to: The visual explanation of how data points in different quadrants contribute to the final correlation value. The assumptions for using Pearson correlation (two metric/continuous variables, linear relationship).
A key limitation of Pearson correlation is that it only captures linear relationships. If you have a relationship with diminishing returns (e.g., stacking armor gives less and less effective health benefit), Pearson correlation might underestimate its strength.
2. Spearman's Rank Correlation ( or )
This is where Spearman correlation comes in. Instead of using the raw data values, it first converts them to ranks (1st, 2nd, 3rd, etc.) and then performs a Pearson correlation on those ranks.
This makes it perfect for two scenarios:
- When the relationship is monotonic but not linear (i.e., it consistently increases or decreases, but not in a straight line).
- When your data is already in ranks (ordinal data), like player leaderboards, league tiers (Bronze, Silver, Gold), or item rarity.
This method is highly relevant to your goal of modeling player skill, which is often represented by a rank or rating.
Let's see how it works.
Correlation Analysis - Full Course in 30 min
Let's return to the 'Correlation Analysis' video to understand this powerful alternative.
Now watch the section on Spearman Correlation from 08:31 to 12:02. Focus on the core idea: it's not about the raw values, but their relative order.
Test your understanding!
You want to investigate the relationship between two variables in your strategy game:
- A player's final rank in a competitive season (e.g., 1st, 2nd, ..., 5000th).
- The number of unique units they used throughout the season.
Which correlation coefficient, Pearson or Spearman, would be more appropriate here, and why?
Show answer
Spearman's rank correlation would be more appropriate. The player's rank is ordinal data, not continuous. Spearman is designed to work with ranked data, whereas Pearson assumes continuous, metric data and a linear relationship, which may not apply here. Spearman will tell you if a higher rank (a lower number, like 1st) is consistently associated with using more (or fewer) unique units.
Correlation in Practice: From Data to Design Insights
Calculating an value is only the first step. The real power comes from using it to make design decisions.
Application 1: Identifying Key Metrics for Winning
In a complex game like an RTS or Grand Strategy title, hundreds of variables could contribute to a win. Correlation analysis helps you identify which ones matter most. By correlating various gameplay metrics (like resource income, units lost, technology researched) with the outcome (win/loss), you can discover the strongest predictors of success.
This is exactly what was done in an analysis of professional League of Legends matches.
STATISTICAL ANALYSIS AND MACHINE LEARNING TO ...
This research paper, 'STATISTICAL ANALYSIS AND MACHINE LEARNING TO PREDICT WINS IN PROFESSIONAL LEAGUE OF LEGENDS', is a perfect example of applied correlation. The authors developed several custom metrics and then calculated their correlation with winning to build a predictive model.
Please read section 4.4 Winning Metrics and Correlation and the beginning of section 5.4 Predicting Wins. You can find these on pages 25-26 and 33 of the PDF. Focus on the correlation values reported for metrics like TDF (-0.442) and CPF (0.431). Notice how the researchers interpret these values and use them to weight the variables in their final 'Xander Factor of Winning' (XFW) equation. This is a direct application of using correlation to inform a balancing model.
This paper demonstrates how correlation coefficients aren't just abstract numbers; they become weighting factors in a practical model for predicting outcomes, a technique directly applicable to your goal of creating more rigorous balance frameworks.
Application 2: Validating a Model of Player Skill
You've expressed a strong interest in modeling abstract concepts like player skill. Correlation is a key tool for validating such models. If you build a metric intended to represent skill, you can check its validity by correlating it with an external measure of skill, like player rank or self-reported survey data.
Researchers did this when developing a system to measure player engagement in PlayerUnknown’s Battlegrounds (PUBG).
Real-Time Player Engagement Measurement Using ...
In the paper 'Real-Time Player Engagement Measurement Using Non-Intrusive Game Telemetry', the authors built a model to estimate player skill and challenge from game data. To see if their 'skill estimate' was meaningful, they correlated it with players' own ratings of their skill.
Please read subsection 7) Robustness to Perceptual Variability (found within Section V.B. Evaluation). It's a short section, but the key is in Figure 9 and the accompanying text. The researchers found a moderate positive correlation (ρ = 0.39) between their skill estimate and what players reported. This gave them confidence that their model was on the right track.
The Most Important Caveat: Correlation ≠ Causation
This is the single most important principle in statistical analysis. Just because two variables are correlated does not mean one causes the other. There might be a third, unmeasured variable (a lurking variable) causing both.
The classic example is the strong positive correlation between ice cream sales and shark attacks. Does eating ice cream cause shark attacks? No. The lurking variable is hot weather, which causes more people to buy ice cream and more people to go swimming.
In game design, you might find a strong correlation between players who buy a specific cosmetic item and a higher win rate. This doesn't mean the item is "pay-to-win." It's more likely that highly engaged, high-skill players (the lurking variable) are both more likely to win and more likely to buy cosmetic items.
Understanding this distinction is critical to avoid making incorrect balance changes based on spurious correlations.
Correlation Analysis - Full Course in 30 min
To drive this crucial point home, let's watch the final section of the 'Correlation Analysis' video.
Please watch the segment on Correlation and Causation from 23:00 to 26:55. This provides clear examples and outlines the conditions needed to even begin talking about causality.
Conclusion and Next Steps
Today we've added a fundamental technique to your analytical arsenal. You can now go beyond looking at metrics in isolation and begin to map the web of relationships that define your game's dynamics.
Key Takeaways:
- Correlation measures the strength and direction of a relationship between two variables, quantified by the correlation coefficient (from -1 to +1).
- Scatter plots are the primary tool for visualizing these relationships.
- Pearson correlation is used for linear relationships between continuous variables.
- Spearman correlation is used for ranked data or non-linear, monotonic relationships.
- Correlation is a powerful tool for identifying key performance indicators and validating models of abstract concepts like skill.
- Crucially, correlation does not imply causation. Always be on the lookout for lurking variables before drawing conclusions.
In our next lesson, we will discuss the Law of Large Numbers. This principle helps explain why the theoretical probabilities and expected values we design into our games (like a 20% crit chance) actually manifest as stable, predictable outcomes when observed across thousands or millions of player actions. It's the concept that ties our design intent to real-world player experience.