Hello! Welcome to the final lesson of our first module, "Statistical Foundations for Game Balance."
In our last lesson, we explored the Law of Large Numbers, which gives us the confidence that the theoretical probabilities you design will emerge from player data over many game sessions. We now know that metrics like win rates and pick rates will stabilize, given a large enough sample size.
This brings us to a crucial question: What values should they stabilize to? If a faction in your RTS has a 55% win rate, is that balanced? What if it's picked in 90% of games, or only 1%? Simply achieving statistical stability isn't the end goal; we need to define what a "healthy" or "balanced" state looks like.
Today, you will learn to define a balanced system by establishing target ranges for key metrics like win rates and pick rates based on design goals. This is where we transition from pure statistics to the art and science of design intent, creating a quantitative definition of success for your game's ecosystem.
Why "50% Win Rate" Isn't the Whole Story
The most intuitive metric for balance is win rate. For a symmetric game like Chess, the ideal is a 50% win rate for White. However, in complex strategy games with asymmetric factions, units, or strategies, win rate alone is a dangerously incomplete picture. Player experience is often shaped as much by what they play against as by what they win or lose with.
This is where a second key metric comes in: pick rate (also called play rate, frequency, or prevalence).
To see why both are essential, let's watch a segment from a GDC talk by Seth Jaffe, who worked on balancing PlayStation All-Stars Battle Royale.
Metagame Balance For eSports & Fighting Games
In this clip from 'Metagame Balance For eSports & Fighting Games', Jaffe explains the disconnect designers often see between win rates, player complaints, and what characters are actually being played.
Watch from 01:15 to 04:30. Pay close attention to the discussion around the characters Kratos and Raiden. Note the discrepancy between their win rates and their play frequency, and how that relates to player perception.
As Jaffe points out, Kratos and Raiden had very high pick rates, which made the game feel dominated by them, even though their win rates weren't exceptional. This demonstrates a core principle: a balanced system needs to consider both the effectiveness (win rate) and the popularity (pick rate) of its strategic options.
Visualizing the State of Balance
The industry-standard method for analyzing these two metrics together is a simple scatter plot. By plotting win rate on one axis and pick rate on the other, you can get an immediate, comprehensive snapshot of your game's meta.
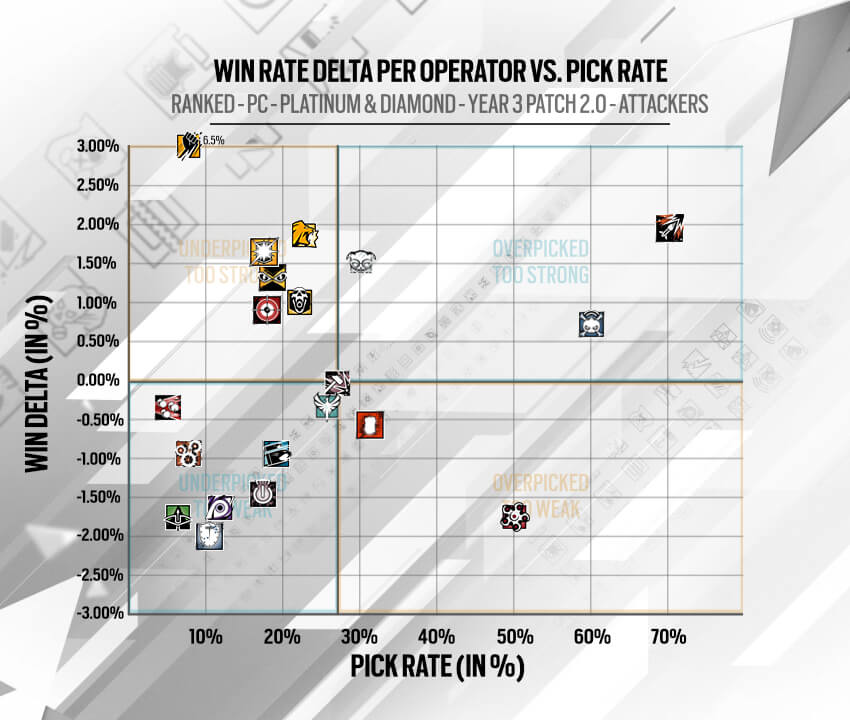
This visualization is incredibly powerful because it allows you to categorize your game's elements and prioritize your work:
- Top-Right (Overpicked & Strong): These are dominant, "broken" strategies. They are both popular and highly effective. This is the highest priority for nerfs.
- Bottom-Left (Underpicked & Weak): These are irrelevant or "useless" options. They are unpopular and ineffective. This is the highest priority for buffs.
- Top-Left (Underpicked & Strong): The "niche" or "sleeper" category. These are effective but not popular. They might be high-skill-cap units, effective-but-situational counters, or simply undiscovered by the player base. These often don't require changes.
- Bottom-Right (Overpicked & Weak): These are "fan favorites" or "noob traps." They are popular for reasons other than power (e.g., aesthetics, fun mechanics) but are not statistically effective. These are a player-experience concern more than a balance one.
Your goal as a designer is not to get every single point to the exact center (50% win rate, average pick rate). Rather, the goal is to have a healthy cluster of viable options within a defined "balanced" zone near the center.
Defining Your Target Zone
So, how do we define that "balanced" zone? This is where your design goals come into play. Do you want a game where all factions are roughly equal, or do you want to encourage a rock-paper-scissors dynamic?
The Case for "Perfect Imbalance"
Perfect mathematical equality, where every option is identical in power, can be incredibly boring. It removes the joy of discovery and optimization that players love.
The video 'Board Game Balance is a MESS' makes a compelling case for what the author calls 'perfect imbalance'.
Please watch from 05:27 to 07:14. Focus on the argument against perfect mathematical balance and the concept of using intentional, tiny differences in power to create a dynamic and discoverable metagame.
This idea of "perfect imbalance" is key: you are intentionally creating small gaps for players to exploit, which keeps the metagame in flux. This means your target for "balance" is a range, not a single point. For example, you might decide that any faction with a win rate between 48% and 52% is considered balanced.
Method 1: A Composite Meta Score
One practical way to define a target is to combine your key metrics into a single score. This is famously done by the data analytics site Vicious Syndicate for the game Hearthstone.
vS Meta Score: A New Metric Measuring an Archetype’s Standing in the Meta
This article, 'A New Metric Measuring an Archetype's Standing in the Meta', explains their methodology for creating a single 'Meta Score' from win rate and play rate data.
Read the article, focusing on: Why win rate and prevalence are insufficient on their own. How the 'Power Score' and 'Frequency Score' are calculated and then averaged to get the 'vS Meta Score'. How the distribution of scores on the plot can indicate the overall health of the meta.
The vS Meta Score is a great example of formalizing a balance target. A "balanced" meta, by their definition, is one where multiple different archetypes have high scores, indicating they are both powerful and popular. An "oppressive" meta is one where a single archetype has a near-perfect score, pushing all others down.
Method 2: Weighted Balance Value Based on Role
In your work on RTS and Grand Strategy games, factions and units have specific roles. A frontline tank unit is not supposed to have the same damage output as a fragile artillery piece. Your balance definition should reflect this design intent.
A research paper on balancing MOBA games proposes a method that is highly applicable here. It suggests creating a weighted "Balance Value" for each hero.
Improved Balance in Multiplayer Online Battle Arena Games
The paper 'Improved Balance in Multiplayer Online Battle Arena Games' outlines a system for quantifying balance based on a hero's intended role.
Please read Chapter 5.1: Evaluation System for the Dynamic Data Balance of Heroes (starts on page 21). Focus on these key ideas: The formula for the 'Balance Value' M, which is a weighted sum of different performance factors (damage, stun, healing, etc.). How heroes are clustered into roles ('Carry', 'Support'). The crucial insight: the weights used in the formula change depending on the hero's role. For a Carry, damage is weighted heavily. For a Support, stuns and healing are weighted more heavily. Finally, they define a hero as 'balanced' if its final Balance Value falls within a target range (e.g., 0.4 to 0.6).
This method provides a sophisticated blueprint for you:
- Identify Key Metrics: For an RTS unit, this could be win rate when built, damage dealt per resource cost, resources gathered, etc.
- Define Roles: "Main battle tank," "Economic harvester," "Early-game harasser," "Late-game siege unit."
- Assign Weights: For the "Main battle tank," effective health and damage taken might have high weights. For the "Economic harvester," resources gathered per minute is the key metric.
- Establish a Target Range: Calculate the weighted "Balance Value" for all units. Your goal is to have all units fall within a healthy range, acknowledging that their contributions to winning are different.
Test your understanding!
You are designing a Grand Strategy game with two factions, A and B.
- Faction A is a 'rush' faction, designed to be strong early but fall off late.
- Faction B is an 'economic boom' faction, designed to be weak early but powerful late.
You observe that across all games, both factions have a 50% win rate. However, you notice that 80% of games are ending within the first 15 minutes with a win for Faction A.
Why is a simple 50% overall win rate a poor definition of balance in this case? How might you define a better target metric?
Show answer
The 50% overall win rate is misleading because it hides a critical pacing problem. The game is not delivering on the design goal of allowing Faction B to reach its powerful late-game stage.
A better set of target metrics would incorporate game duration. For example, you could define balance as:
- Faction A's win rate in games under 20 minutes should be around 60-70%.
- Faction B's win rate in games over 20 minutes should be around 60-70%.
- The overall distribution of game lengths should have a significant number of games lasting longer than 20 minutes, ensuring that Faction B's strategy is viable.
This approach defines balance in a way that respects the intended power curves and playstyles of the factions.
The Impact of Player Interaction
Finally, how wide can your target ranges be? This often depends on the structure of your game.
In the board game video, the speaker introduced two concepts:
- Absolute Balance: The raw numbers and mechanics you design.
- Relational Balance: The ability for players to interact and police one another, ganging up on a leader or countering a strong strategy.
RTS games typically have very strong relational balance. Players can scout, adapt their build orders, and focus-fire units to counter a threat. Grand Strategy games can have this too, through alliances and joint wars.
The more tools you give players to police each other, the more resilient your game is to minor imperfections in absolute balance. This means you can often afford to have slightly wider target ranges for your metrics, as the players themselves will act as a balancing force.
Conclusion
This lesson marks the end of our first module. We've journeyed from basic statistical measures to a sophisticated, design-driven definition of a balanced system.
Key Takeaways:
- A balanced system is not defined by a single number (like a 50% win rate), but by achieving a healthy range for a set of key metrics.
- The most common and powerful metrics are win rate and pick rate, which should be analyzed together, often on a scatter plot.
- Your definition of "balance" must be derived from your design goals. This can be quantified by creating composite scores (like a weighted "Balance Value") where metrics are weighted according to a unit's intended role.
- The ideal target ranges are influenced by design philosophy (e.g., embracing "perfect imbalance" to encourage discovery) and the degree of player interaction in your game.
You now have a complete foundational framework for using statistics to analyze and define balance.
Preview of the Next Module:
In Module 2, "Game Theory for Strategic Interactions," we will shift from analyzing outcomes to designing interactions. We'll start by learning how to construct payoff matrices to model simple strategic interactions, like one unit fighting another. This will give you the tools to proactively design the rock-paper-scissors relationships and counter-dynamics that lead to the healthy metagames we've just defined.