Welcome to the second lesson in our module on analyzing and visualizing movie trends.
In our previous session, we successfully aggregated our data to identify the single most-watched movie for each country during the pre-Christmas period. We ended up with a tidy DataFrame that looks something like this:
| country | movie_title | appearance_count |
|---|---|---|
| UK | Love Actually | 2 |
| USA | Elf | 3 |
| ... | ... | ... |
Today, we'll take this summary data and transform it into a powerful visualization. Our goal is to design a choropleth map to display the single most popular movie in each country. This will give us an immediate, at-a-glance view of global movie preferences, which is central to our project.
We will learn what a choropleth map is, why it's suitable for our task, and how to create one using Python's Plotly Express library. A key focus will be on the "design" aspect, particularly how to map a categorical variable like a movie title to a color, which presents a different challenge than mapping numerical data like population density.
1. Understanding Choropleth Maps
A choropleth map is a thematic map that uses colors or shading to represent data values across geographic areas. It’s an excellent tool for visualizing spatial patterns.
To get a formal understanding of the principles behind creating one, let's start with a short reading.
How to create a Choropleth Map: A detailed guide
The article 'How to create a Choropleth Map: A detailed guide' from the Postcode Heatmap Blog provides a clear and concise overview of what choropleth maps are and the steps involved in creating them.
Please read the 'Introduction', 'Understanding Choropleth Maps', and the first point of the 'Step-by-Step Process' ('Define the Objective'). This will reinforce the purpose and basic concept of the visualization we are about to build.
As the article highlights, creating a choropleth map requires two main ingredients:
- Geographic Data: A set of shapes or boundaries for the regions you want to map (e.g., countries, states).
- Statistical Data: A value for each region that you want to visualize.
In our case, the regions are countries, and the value is the most popular movie title. The magic of modern libraries like Plotly is that they often come with built-in geographic data for world countries, so we don't have to source it ourselves. We just need to provide our statistical data in a way the library can understand.
2. The Challenge: Visualizing Categorical Data
Most choropleth map tutorials you'll find focus on visualizing numerical data, like GDP per capita or population density. This type of data is typically represented using a sequential color scale (e.g., light blue to dark blue for low to high values) or a diverging scale (e.g., red to blue for values below and above an average).
Our data, movie_title, is categorical. We don't want a gradient; we need a distinct color for each unique movie. This requires a qualitative color scheme.
The image below illustrates these three fundamental types of color schemes.
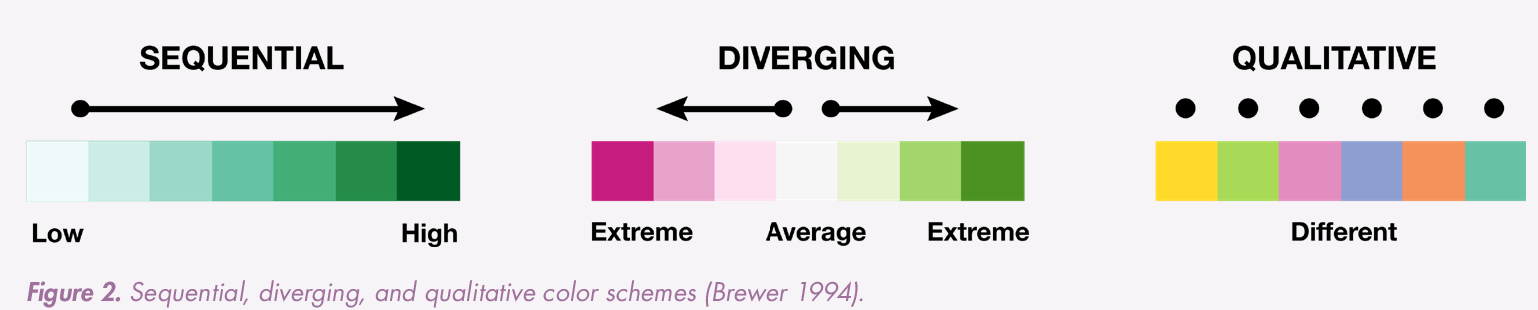
Choosing the right color scheme is a critical design decision. A qualitative scheme ensures that no movie is unintentionally portrayed as "higher" or "lower" than another, which a sequential scheme would imply.
3. Building the Map with Plotly Express
We will use Plotly Express, a high-level Python library that makes creating interactive visualizations straightforward. It's built on top of plotly.py and is particularly well-suited for working with pandas DataFrames.
Let's watch a short video to get acquainted with Plotly and the basic syntax for creating a choropleth map. Keep in mind the video uses numerical data (population density), so we will need to adapt the approach for our categorical data.
Plotting Choropleth Maps using Python (Plotly)
The video 'Plotting Choropleth Maps using Python (Plotly)' by Indian Pythonista gives a great introduction to the plotly.express library and the px.choropleth function. We'll focus on the initial setup and the core function call.
Please watch from 00:00 to 02:31 to understand what Plotly is. Then, skip to 12:24 and watch until 15:21. Focus on the px.choropleth() function call and its main arguments like data_frame, locations, geojson, and color. Notice that we won't need the complex GeoJSON handling part (from 02:31 to 12:24) because Plotly has built-in world map geography.
Step-by-Step Implementation
Now, let's apply what we've learned to our specific problem.
Step 1: Prepare the Data
First, let's assume we have our top_movies_per_country DataFrame from the previous lesson. Plotly's px.choropleth function is smart and can often recognize country names directly. For best results, it's good practice to use standard identifiers like ISO 3166-1 alpha-3 country codes (e.g., 'USA', 'GBR', 'FRA'). Plotly includes a dataset that can help with this mapping if needed, but for now, we'll proceed with country names.
Here's a sample DataFrame we can work with:
import pandas as pd
import plotly.express as px

# Sample DataFrame from the previous lesson
data = {
    'country': ['United States', 'United Kingdom', 'Canada', 'France', 'Germany', 'Australia', 'Japan'],
    'movie_title': ['Elf', 'Love Actually', 'The Grinch', 'Le Père Noël est une ordure', 'Drei Haselnüsse für Aschenbrödel', 'The Grinch', 'Tokyo Godfathers'],
    'appearance_count': [25, 22, 19, 28, 26, 15, 12]
}
top_movies_per_country = pd.DataFrame(data)
Step 2: Create the Basic Choropleth Map
The px.choropleth() function is the workhorse. We pass our DataFrame and specify which columns map to which visual elements.
fig = px.choropleth(
    data_frame=top_movies_per_country,
    locations='country',            # Column with country names
    locationmode='country names',   # Type of location data
    color='movie_title',            # Column to determine color (our categorical variable!)
    hover_name='country',           # What to show as the title on hover
    hover_data={'movie_title': True, 'appearance_count': True, 'country': False}, # Additional data on hover
    title='Most Popular Pre-Christmas Movie by Country'
)

fig.show()
Let's break down the key parameters:
locations='country': We tell Plotly to use thecountrycolumn to identify the geographic regions.locationmode='country names': This specifies that thelocationscolumn contains full country names. Other options include'ISO-3'.color='movie_title': This is the crucial part. We're mapping themovie_titlecolumn to color. Because this column contains strings (categorical data), Plotly automatically applies a qualitative color scheme and creates a discrete legend.hover_nameandhover_data: These control the interactive tooltip, making the map more informative. Here, hovering will show the country, its top movie, and the appearance count.
Step 3: Designing and Refining the Map
A good map isn't just functional; it's well-designed.
-
Custom Colors: What if "The Grinch" is popular in multiple countries and we want it to be green? You can define specific colors for your categories using the
color_discrete_mapargument. This gives you full design control.color_map = { 'The Grinch': 'green', 'Love Actually': 'pink', 'Elf': '#FDBA31' # A specific hex code for yellow } fig = px.choropleth( # ... other arguments ... color_discrete_map=color_map )Any movie not in the map will be assigned a color from the default palette.
-
Handling Missing Data: Countries in our list that Plotly doesn't recognize, or countries not in our dataset, won't be colored. Plotly renders them in a default neutral grey, which is good practice.
Test your understanding!
You have the following DataFrame df_top:
| country | top_movie |
|---|---|
| Brazil | O Auto da Compadecida |
| India | 3 Idiots |
| Nigeria | The Wedding Party |
Write the px.choropleth call to create a world map where Brazil is colored red, and other countries are colored automatically. The title of the map should be "National Movie Favorites".
Show answer
import plotly.express as px

fig = px.choropleth(
    data_frame=df_top,
    locations='country',
    locationmode='country names',
    color='top_movie',
    hover_name='country',
    title='National Movie Favorites',
    color_discrete_map={
        'O Auto da Compadecida': 'red'
    }
)

fig.show()
This code correctly identifies the country and top_movie columns, sets the title, and uses color_discrete_map to assign a specific color to Brazil's top movie.
Conclusion
In this lesson, you have learned how to take aggregated data and present it geographically. We have moved from a simple table of top movies to a rich, interactive map that tells a global story.
Key Takeaways:
- Choropleth maps visualize data across geographic regions by coloring them according to a specific variable.
- Visualizing categorical data (like movie titles) requires a qualitative color scheme, where each category gets a distinct color.
- Plotly Express (
px.choropleth) simplifies map creation by handling geographic boundaries automatically and integrating directly withpandasDataFrames. - Key parameters like
locations,locationmode,color, andhover_namegive you control over the map's data binding. - Design elements like
titleandcolor_discrete_mapallow you to refine the map's aesthetics and clarity.
You now have a powerful new visualization for your project. However, a world map can make it difficult to compare specific countries, especially if they have similar colors or are far apart.
In our next lesson, we will address this by learning how to generate comparative bar charts to visualize top movie preferences for selected countries. This will allow for a more detailed, side-by-side analysis of movie tastes.