Welcome back! In our last lesson, we compared the different development strategies and reform paths taken by India, China, and Pakistan. We saw how their unique political contexts and policy choices caused their economic journeys to diverge, despite starting from similar points.
Today, we will examine the results of those strategies. This lesson focuses on comparing the three nations across key demographic indicators and their sectoral development. This is a crucial topic for your board exam and often appears in the form of data interpretation questions based on tables. Our goal is to equip you to confidently analyze this data and draw meaningful conclusions.
1. Comparing Demographic Indicators
Demographic indicators give us a snapshot of a country's population characteristics. Understanding these helps explain a country's development challenges and successes. Let's start by looking at key metrics like population size, growth rate, density, sex ratio, and urbanisation.
Comparative experience of India and Its neighbours | India China and Pakistan | Class 12 | One shot
To get a quick and exam-focused overview, let's watch a section from the video by Rajat Arora. He's great at highlighting the specific trends you need to remember for your exam.
Watch the segment on demographic indicators. As you watch, don't worry about memorizing the exact numbers. Instead, focus on the comparison: Which country has the highest population growth rate? Why? How does India's population density compare to China's? Which country has the most skewed (worst) sex ratio? Which country is the most urbanised?
The video gives a clear picture of the trends. Now, let's ground this with the official NCERT textbook data, which provides the most recent figures you should be familiar with.
[PDF] Indian Economic Development\1 Source Files\chapter 8 ... - NCERT
This reading from your NCERT textbook provides the foundational data and explanation for comparing the demographic profiles of the three countries.
Please read Section 8.3, titled "Demographic Indicators", and pay close attention to Table 8.1. Notice how the data in this table (from 2022) reflects the trends discussed in the video. Focus on the brief analysis provided in the text, especially the reasons cited for China's low population growth and the skewed sex ratio across all three nations.
Here's a summary of the key demographic comparisons:
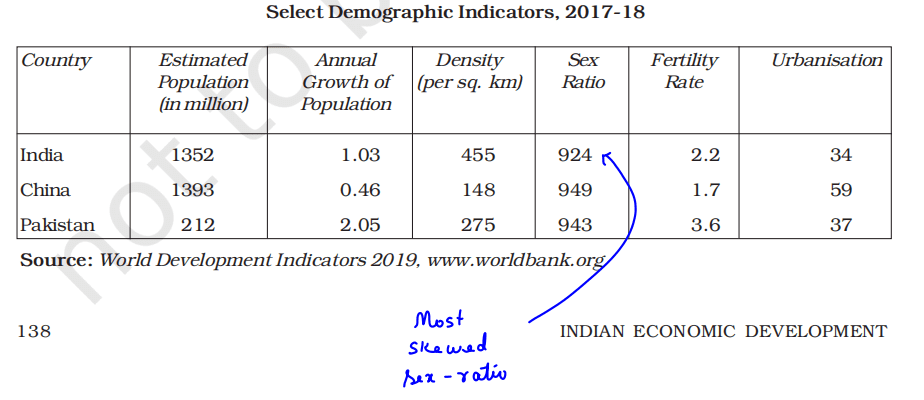
Key Takeaways on Demographics:
- Population Growth: Pakistan has the highest annual population growth rate, which puts significant pressure on its resources. China's growth is the lowest (even negative in recent data) due to its strict population control policies in the past.
- Population Density: India has the highest population density, meaning more people per square kilometre. China, despite its large population, has a lower density due to its vast geographical area.
- Sex Ratio: All three countries have a low sex ratio (fewer females per 1000 males), indicating a strong "son preference." India's sex ratio is particularly low, a point often highlighted in analysis.
- Urbanisation: China is the most urbanised nation of the three, a result of its rapid industrialisation.
2. Comparing Sectoral Development
Now, let's compare the economic structure of the three countries. We'll look at two things:
- Sectoral Contribution to GVA/GDP: How much does agriculture, industry, and the service sector contribute to the country's total output?
- Sectoral Share of Employment: What percentage of the workforce is employed in each of these three sectors?
The comparison reveals a crucial difference in their development paths.
Comparative experience of India and Its neighbours | India China and Pakistan | Class 12 | One shot
Let's turn back to Rajat Arora's video, where he masterfully explains the mismatch between where people work and which sector generates the most income, especially in India and Pakistan.
Watch the segment on sectoral contribution. Pay close attention to his analysis of the tables. He points out a critical issue for India: a very large percentage of the workforce is in agriculture, but the sector's contribution to GVA is very low. This points to low productivity and disguised unemployment.
The video highlights a key analytical point for your exams. Now, let's reinforce this with the NCERT text, which formally describes the different paths of structural transformation.
[PDF] Indian Economic Development\1 Source Files\chapter 8 ... - NCERT
This section of the textbook details the different development trajectories taken by China versus India and Pakistan.
Please read Section 8.4, "Gross Domestic Product and Sectors". Focus your attention on Table 8.3 (Sectoral Share of Employment and GDP) and the analysis that follows. The text clearly explains the "normal course of development" (Agriculture → Industry → Services) that China followed, and the different path (Agriculture → Services) taken by India and Pakistan.
Key Takeaways on Sectoral Development:
- China's Path: Followed the traditional development model. It successfully shifted its workforce from agriculture to industry, making manufacturing the engine of its growth, and then later to services.
- India and Pakistan's Path: Their experience shows a major structural shift directly from the agricultural sector to the service sector. Their industrial sectors remain relatively underdeveloped in terms of employment, leading to what is sometimes called "jobless growth."
- The Agricultural Dilemma: In both India and Pakistan, agriculture still employs the largest share of the workforce (around 46% in India, 37% in Pakistan), but its contribution to GVA is much smaller (19% in India, 24% in Pakistan). This imbalance is a major structural challenge.
- Service Sector Dominance: In all three countries, the service sector is now the largest contributor to GDP.
3. Comparing Human Development Indicators (HDI)
Finally, let's broaden our comparison to look at human development. The Human Development Index (HDI) is a composite statistic that considers life expectancy, education (mean and expected years of schooling), and per capita income. It gives a more holistic view of a country's progress than just economic data.
Comparative development experience of india and its Neighbours | One shot class 12 Indian economy
The video by Sunil Panda provides a very quick and direct comparison of HDI and its components, which is perfect for a rapid overview.
Watch this short clip from HDI comparison. Notice how China consistently performs better than India and Pakistan on almost every indicator, from HDI rank and value to life expectancy and mortality rates.
The video confirms China's lead. For a more detailed look, the NCERT provides a comprehensive table which is an excellent source for potential exam questions.
[PDF] Indian Economic Development\1 Source Files\chapter 8 ... - NCERT
This is a data-rich section that summarizes the human development outcomes.
Please read Section 8.5, "Indicators of Human Development", and carefully study Table 8.5. You don't need to memorise every number, but you should be able to compare the countries on key indicators like: HDI Rank and Value Life Expectancy at Birth Infant and Maternal Mortality Rates Access to Sanitation and Safe Drinking Water
Key Takeaway on Human Development:
China is significantly ahead of both India and Pakistan on most human development indicators. This is often attributed to the state's role in providing social infrastructure and basic health and education services, even before the economic reforms of 1978. Pakistan generally trails behind both India and China on these indicators.
For a quick knowledge check, consider this question from a sample paper:
China moving ahead of India and Pakistan is true for which indicator?
(a) HDI ranking
(b) GDP per capita
(c) Proportion of population below poverty line
(d) All of these
Based on our lesson, the answer is clearly (d) All of these.
Conclusion
In this lesson, we compared the development outcomes for India, China, and Pakistan. By analyzing their demographic, sectoral, and human development data, we can see the tangible results of the strategies they've pursued over the last several decades.
Key Takeaways:
- Demographic Differences: Pakistan faces the challenge of high population growth, while China's past policies have created a different demographic challenge of an ageing population. India struggles with issues like a highly skewed sex ratio.
- Sectoral Imbalance: China built a strong industrial base, following a classic development path. India and Pakistan's growth has been led by the service sector, with agriculture still employing a large, low-productivity workforce.
- Human Development Gap: China has outperformed its neighbours on most measures of human development, including health, education, and poverty reduction.
Now that we have covered the theoretical and comparative aspects of this unit, our next and final lesson will be a purely practical one. We will focus on solving representative CBSE board paper questions (2019–2024) for this entire chapter, fully preparing you for any question that comes your way.