Hello! Welcome back.
In our last lesson, we explored the critical trade-offs of using indexes, focusing on how they improve read performance at the cost of slower writes and increased maintenance. You learned that this isn't a "free lunch" and that the decision to add an index requires careful thought.
This naturally leads to the next question: how do you know if a query is slow because it's missing an index? This lesson provides the answer. We will dive into the single most important tool for debugging query performance: the query execution plan. Your goal for this lesson is to learn how to use a query's execution plan to identify performance bottlenecks, specifically the infamous full table scan.
Mastering this skill is non-negotiable for any developer or technical support professional working with databases. It's the equivalent of a profiler for your code or a packet sniffer for network issues—it shows you exactly what's happening under the hood so you can diagnose the problem.
What is a Query Execution Plan?
When you submit a SQL query, the database doesn't just start blindly fetching data. Instead, a sophisticated component called the Query Optimizer first creates a strategy, or a "recipe," for how to execute the query most efficiently. This recipe is the execution plan.
Think of it like planning a trip using a map application. You enter your destination, and the app calculates various routes, considering factors like traffic, distance, and road types. It then presents you with what it believes is the optimal route. The query optimizer does the same thing for your data, considering available indexes, table sizes, and data distribution statistics to choose the "cheapest" path to your results.
SQL Execution Plans (Visually Explained) | SQL Hints | #SQL Course 40
To start, let's get a high-level visual explanation of what an execution plan is and why it's so important for diagnosing slow queries.
Watch the video from the beginning until 03:03. Pay close attention to the analogy of planning a trip and the idea that the database first plans the query before executing it. Note the different operations it might consider, like a 'Full Table scan' vs. an 'Index scan'.
Generating a Plan: EXPLAIN and EXPLAIN ANALYZE
To see the execution plan for a query, you prepend your SQL statement with the EXPLAIN keyword. There are two main ways to use it, and the difference is crucial:
EXPLAIN: This shows the estimated plan. The database predicts the best way to run the query based on its internal statistics without actually running it. It's very fast and gives you a good idea of the database's intentions.EXPLAIN ANALYZE: This command first executes the query and then shows you the plan that was actually used, along with real performance metrics like the actual time taken and rows processed at each step. This is the most valuable tool for diagnosing real-world performance issues.
For the rest of this course, we will primarily use EXPLAIN ANALYZE because it provides the ground truth of what happened during query execution.
Reading and Interpreting PostgreSQL Query Plans
This article provides a clear introduction to these commands and the structure of a query plan.
Read the sections 'The Basics: Using EXPLAIN and EXPLAIN ANALYZE' and 'Understanding Query Plans: A Tree Structure and How to Read it'. Focus on the difference between the two commands and the concept of reading a plan from the 'inside out'.
How to Read an Execution Plan
Execution plans are typically displayed as a tree of operations. The key is to read the plan from the inside-out (or right-to-left in many visualizers). The most indented operations are executed first, and their results are fed upwards into the less indented operations.
Let's look at a simple query on a table with no indexes.
EXPLAIN ANALYZE SELECT * FROM users WHERE username = 'alex';
You might see an output like this (syntax varies slightly between databases, but the concepts are the same):
QUERY PLAN
---------------------------------------------------------------------------------------------------------------------
Seq Scan on users  (cost=0.00..183.00 rows=1 width=32) (actual time=0.015..1.120 rows=1 loops=1)
  Filter: (username = 'alex'::text)
  Rows Removed by Filter: 9999
Planning Time: 0.075 ms
Execution Time: 1.130 ms
Here are the key things to look for:
- Node Type: The operation being performed. Here it's a
Seq Scan(Sequential Scan). - Cost: The optimizer's estimated expense. It has two parts:
startup_cost..total_cost. A higher number means a more expensive operation. Here, the estimated cost is183.00. - Actual Time: The real time it took to run. Here, it took
1.120milliseconds. - Rows: The estimated number of rows vs. the actual number of rows processed.
The Main Culprit: The Full Table Scan
The most common and significant bottleneck you'll find is the Full Table Scan, which appears as Seq Scan in PostgreSQL or Table Scan in SQL Server and MySQL.
A Full Table Scan means the database had to read every single row in the table from disk and check if it matched your WHERE clause.
For a small table, this is fine. But for a table with millions of rows, it's incredibly inefficient—it's the database equivalent of reading a phone book from A to Z to find one person's number. This is often a clear sign that you are missing an index on the column(s) in your WHERE clause.
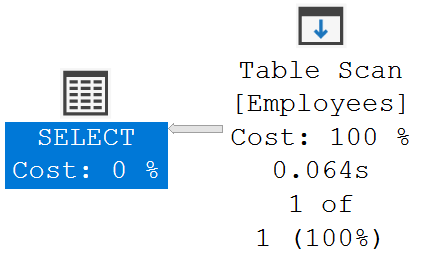
Let's examine why this is a bottleneck.
Query Performance Tuning in PostgreSQL: EXPLAIN ...
This article clearly explains what a Sequential Scan is and why it isn't always bad, but often is for large tables.
Read the sub-section on 'Scan Types', focusing on the definition of 'Sequential scan' and 'Index scan'. This will solidify your understanding of the difference between them.
From Bottleneck to Solution: A Practical Demonstration
Now let's see the magic happen. How does an index fix a Seq Scan? By providing a much more efficient path to the data. Instead of scanning the whole table, the database can use an Index Scan or an Index Seek, which uses the B-Tree structure to find the required rows directly.
SQL indexing best practices | How to make your database FASTER!
The following video provides a perfect, concise demonstration of this process. It shows a query with a full table scan, adds an index, and then shows the new, much more efficient execution plan.
Watch from the beginning until 02:09. Observe how the EXPLAIN ANALYZE output changes from a 'full table scan' to a more efficient plan after adding first a single-column and then a multi-column index.
As you saw, after creating an index, the plan changed. Instead of scanning the whole table, the database used the index to find the relevant rows quickly. The cost and actual time in the plan would have dropped dramatically.
Test your understanding!
You are investigating a slow query in your application. The table products has 5 million rows.
The query is:SELECT product_name, price FROM products WHERE sku = 'ABC-12345';
You run EXPLAIN ANALYZE and get the following output:
QUERY PLAN
-----------------------------------------------------------------------------------------------------------------
Seq Scan on products  (cost=0.00..85432.50 rows=1 width=45) (actual time=0.050..356.402 rows=1 loops=1)
   Filter: (sku = 'ABC-12345'::text)
   Rows Removed by Filter: 4999999
Planning Time: 0.120 ms
Execution Time: 356.515 ms
- What is the primary bottleneck operation in this plan?
- Explain in one sentence why this operation is inefficient for this query.
- What single line of SQL would you write to likely solve this performance problem?
Show answer
-
The primary bottleneck is the
Seq Scan(Sequential Scan) on theproductstable. -
This operation is inefficient because it reads all 5 million rows from the table just to find the single row with the matching
sku. -
You would create an index on the
skucolumn:CREATE INDEX idx_products_sku ON products (sku);After adding this index, a new execution plan would likely show an
Index ScanorIndex Seek, which would have a much lower cost and a significantly faster execution time.
Conclusion
You now have the fundamental tool to look inside the database's mind. By using EXPLAIN ANALYZE, you can move from guessing about performance to making data-driven decisions.
Key Takeaways:
- The Query Optimizer creates an execution plan, which is a step-by-step recipe for how to run your query.
EXPLAIN ANALYZEis your primary tool for seeing the actual plan and its real-world performance.- Execution plans are read from the inside-out; the most indented steps happen first.
- A
Seq Scan(Full Table Scan) on a large table is a major performance bottleneck, as it forces the database to read every row. - Identifying a
Seq Scanwhere a selectiveWHEREclause is being used is the clearest indicator that an index is needed.
Preview of the Next Lesson:
You might assume that if an index exists on a column, the optimizer will always use it. Unfortunately, that's not always true. Sometimes, the way you write your query can prevent the optimizer from using an otherwise perfect index. In our next lesson, we will learn how to rewrite a non-SARGable WHERE clause condition to enable index usage, ensuring your carefully created indexes don't go to waste.