Hello! Welcome to your next lesson in advanced organic chemistry.
In our previous session, we saw how Infrared (IR) spectroscopy allows us to identify functional groups by observing their characteristic vibrations. While incredibly useful, IR tells us little about the carbon-hydrogen framework of a molecule. Today, we introduce a new, profoundly powerful technique: ¹H Nuclear Magnetic Resonance (NMR) Spectroscopy. NMR provides a detailed map of a molecule's structure by probing the unique electronic environment of every hydrogen atom.
Your learning outcome for this lesson is to use the number of signals and their integration in a ¹H NMR spectrum to deduce structural information.
By the end of this lesson, you will be able to look at an ¹H NMR spectrum and determine two crucial pieces of information:
- How many different types of hydrogen atoms are in a molecule.
- The ratio of these different types of hydrogens.
We will focus exclusively on these two aspects today. In subsequent lessons, we will explore what the position of the signals (chemical shift) and their shape (splitting) tell us.
1. The Quantum Mechanical Basis of NMR
Given your interest in the "why" behind chemistry, let's start with the quantum principles that make NMR possible. The 'N' in NMR stands for "Nuclear," and the phenomenon originates from a fundamental property of atomic nuclei called spin.
Nuclei with an odd number of protons or an odd number of neutrons (or both) possess a non-zero spin, which causes them to behave like tiny bar magnets. The proton, ¹H, is the simplest and most important example in organic chemistry.
In the absence of an external magnetic field, these nuclear magnets are oriented randomly. However, when placed in a strong external magnetic field, , they can only align in specific, quantized states. For a spin-½ nucleus like a proton, there are two allowed states:
- α-spin state: Aligned with the external field (lower energy).
- β-spin state: Aligned against the external field (higher energy).
The energy difference between these states, , is directly proportional to the strength of the external magnetic field, . By applying electromagnetic radiation in the radio frequency (RF) range, we can provide exactly the right amount of energy () to cause a proton to "flip" from the lower-energy α-state to the higher-energy β-state. This absorption of energy is called resonance.
The following video provides an excellent visualization of this entire process, from nuclear spin and precession to the generation of an NMR signal.
The video 'NMR spectroscopy visualized' from the ScienceSketch channel beautifully illustrates the quantum mechanical principles of NMR. It shows how nuclei behave in a magnetic field, what an RF pulse does, and how the resulting signal is processed.
Please watch from the beginning to 04:53. Focus on understanding the concepts of nuclear spin, precession in a magnetic field, the effect of the RF pulse, and how the Free Induction Decay (FID) signal is converted into an NMR spectrum via a Fourier Transform.
As the video explained, the key to NMR's utility is that not all protons in a molecule resonate at the same frequency. The exact frequency depends on the proton's local electronic environment. This is what we will explore next.
2. The Number of Signals: Chemical Equivalence
The number of distinct signals in an ¹H NMR spectrum corresponds to the number of chemically non-equivalent sets of protons in the molecule. Protons that are in identical electronic environments are called chemically equivalent, and they contribute to the same signal.
To determine chemical equivalence, symmetry is the key.
The textbook chapter 'Chapter 5: NMR' provides a clear and systematic explanation of chemical equivalence with good examples.
Please read Section 5.2, 'Chemical equivalence' (starts on page 8). This section explains how to identify sets of equivalent and non-equivalent protons by looking at the molecular structure and its symmetry.
From the reading, we can summarize the main ideas:
- Equivalent protons will give one signal.
- Non-equivalent protons will give different signals.
For a deeper analysis, chemists classify protons based on symmetry relationships:
- Homotopic Protons: These are protons that can be interchanged by a rotational axis of symmetry (Cₙ). Homotopic protons are always chemically equivalent. For example, the three protons of a methyl group (-CH₃) are homotopic.
- Enantiotopic Protons: These are protons that can be interchanged by a plane of symmetry (σ). They are mirror images of each other. In a standard, achiral NMR solvent, enantiotopic protons are chemically equivalent and give a single signal. For example, the two protons on C-1 of ethanol (CH₃CH₂OH) are enantiotopic.
- Diastereotopic Protons: These protons are not related by any symmetry operation (rotation or reflection). They are chemically non-equivalent and will give two separate signals. This most commonly occurs when two protons are on a carbon that is adjacent to a chiral center.
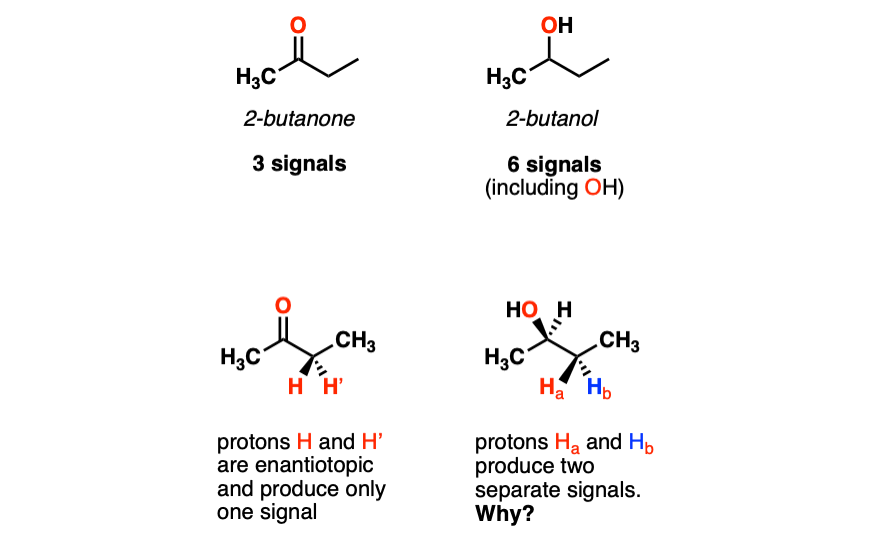
Understanding diastereotopicity is a great example of the "hyper deep" level of analysis you are seeking. It's a beautiful intersection of stereochemistry and spectroscopy.
3. Signal Integration: Counting the Protons
We now know that the number of signals tells us how many unique proton environments there are. The second crucial piece of information, integration, tells us how many protons are in each environment.
The area under an NMR signal is directly proportional to the number of protons that generate that signal. The NMR spectrometer can automatically calculate these areas and display them, typically as a step-curve over the peaks or as a numerical value.
This provides a relative ratio of the number of protons in each set.

If you know the molecular formula, you can convert the relative ratio into the absolute number of protons for each signal.
5. Proton Nuclear Magnetic Resonance Spectroscopy
For a more rigorous look at integration, this document from Prof. Hans Reich at the University of Wisconsin provides a detailed analysis.
Please read the section '5.1 Integration of Proton NMR Spectra'. Focus on the example provided, which shows how to use the molecular formula (C₈H₁₀O₂S) and the measured integral values (in mm) to determine the absolute number of protons for each signal.
As that reading demonstrates, you can determine the number of protons per signal with the following steps:
- Sum the relative integration values (or measured integral lengths).
- Divide the total number of hydrogens from the molecular formula by this sum to get a "protons per integration unit" value.
- Multiply each individual integration value by this factor to find the absolute number of protons for that signal.
For instance, in the example from the reading:
- Total hydrogens = 10.
- Total integral length = 74.2 mm.
- Protons per mm = 10 H / 74.2 mm ≈ 0.135 H/mm. (The resource does it the other way: mm per H = 7.4).
- For the peak at ~7.8 ppm: 36.2 mm * (10 H / 74.2 mm) = 4.88 H ≈ 5H.
This quantitative nature is unique to NMR and makes it exceptionally powerful for structure elucidation.
Test your understanding!
Consider the three constitutional isomers of C₅H₁₂: pentane, isopentane (2-methylbutane), and neopentane (2,2-dimethylpropane).
For each isomer:
- Draw the structure.
- Determine the number of chemically distinct sets of protons.
- Predict the integration ratio of the signals in the ¹H NMR spectrum.
Show answer
-
Pentane (CH₃-CH₂-CH₂-CH₂-CH₃)
- There are three sets of chemically equivalent protons due to the plane of symmetry in the middle of the molecule:
- (a) The two CH₃ groups at the ends.
- (b) The two CH₂ groups adjacent to the ends.
- (c) The central CH₂ group.
- Number of signals: 3
- Integration ratio: 6(a) : 4(b) : 2(c), which simplifies to 3 : 2 : 1.
- There are three sets of chemically equivalent protons due to the plane of symmetry in the middle of the molecule:
-
Isopentane (2-methylbutane)
- There are four sets of chemically distinct protons:
- (a) The two CH₃ groups of the isopropyl fragment (they are equivalent).
- (b) The single H on the tertiary carbon.
- (c) The CH₂ group.
- (d) The terminal CH₃ group.
- Number of signals: 4
- Integration ratio: 6(a) : 1(b) : 2(c) : 3(d).
- There are four sets of chemically distinct protons:
-
Neopentane (2,2-dimethylpropane)
- All four methyl groups are attached to a central quaternary carbon. Due to the high symmetry of the molecule, all 12 protons are chemically equivalent.
- Number of signals: 1
- Integration ratio: There is only one peak, so the integration is simply 12.
Conclusion
In this lesson, you have learned to extract the first two fundamental pieces of information from an ¹H NMR spectrum. This moves us from identifying functional groups with IR to mapping out the actual C-H skeleton of a molecule.
Key Takeaways:
- NMR probes nuclei with spin (like ¹H) by flipping them between quantized spin states in a strong magnetic field using radio waves.
- The number of signals in an ¹H NMR spectrum tells you the number of sets of chemically equivalent protons. Equivalence is determined by molecular symmetry.
- Protons can be classified as homotopic, enantiotopic (usually equivalent), or diastereotopic (non-equivalent).
- The integration (area under a signal) is directly proportional to the number of protons creating that signal, giving you a relative ratio of protons in each unique environment.
Preview of the Next Lesson:
We have learned to count the number of proton types and their relative abundance. But why do the signals appear at different positions on the x-axis? In the next lesson, we will answer this by diving into the concept of chemical shift. You will learn how the electronic environment "shields" or "deshields" protons from the external magnetic field, causing their signals to shift to different frequencies and providing even more structural clues.