Welcome back. In our previous module, we explored fallacies that misuse history and prescription to pass unfair judgment. We concluded with the Historian's Fallacy, where critics use hindsight to condemn past choices.
We now enter a new module, "Statistical and Probabilistic Manipulation," where your background as a statistician will be a distinct advantage. We will dissect arguments that misuse numbers and probability to create a misleading picture of reality.
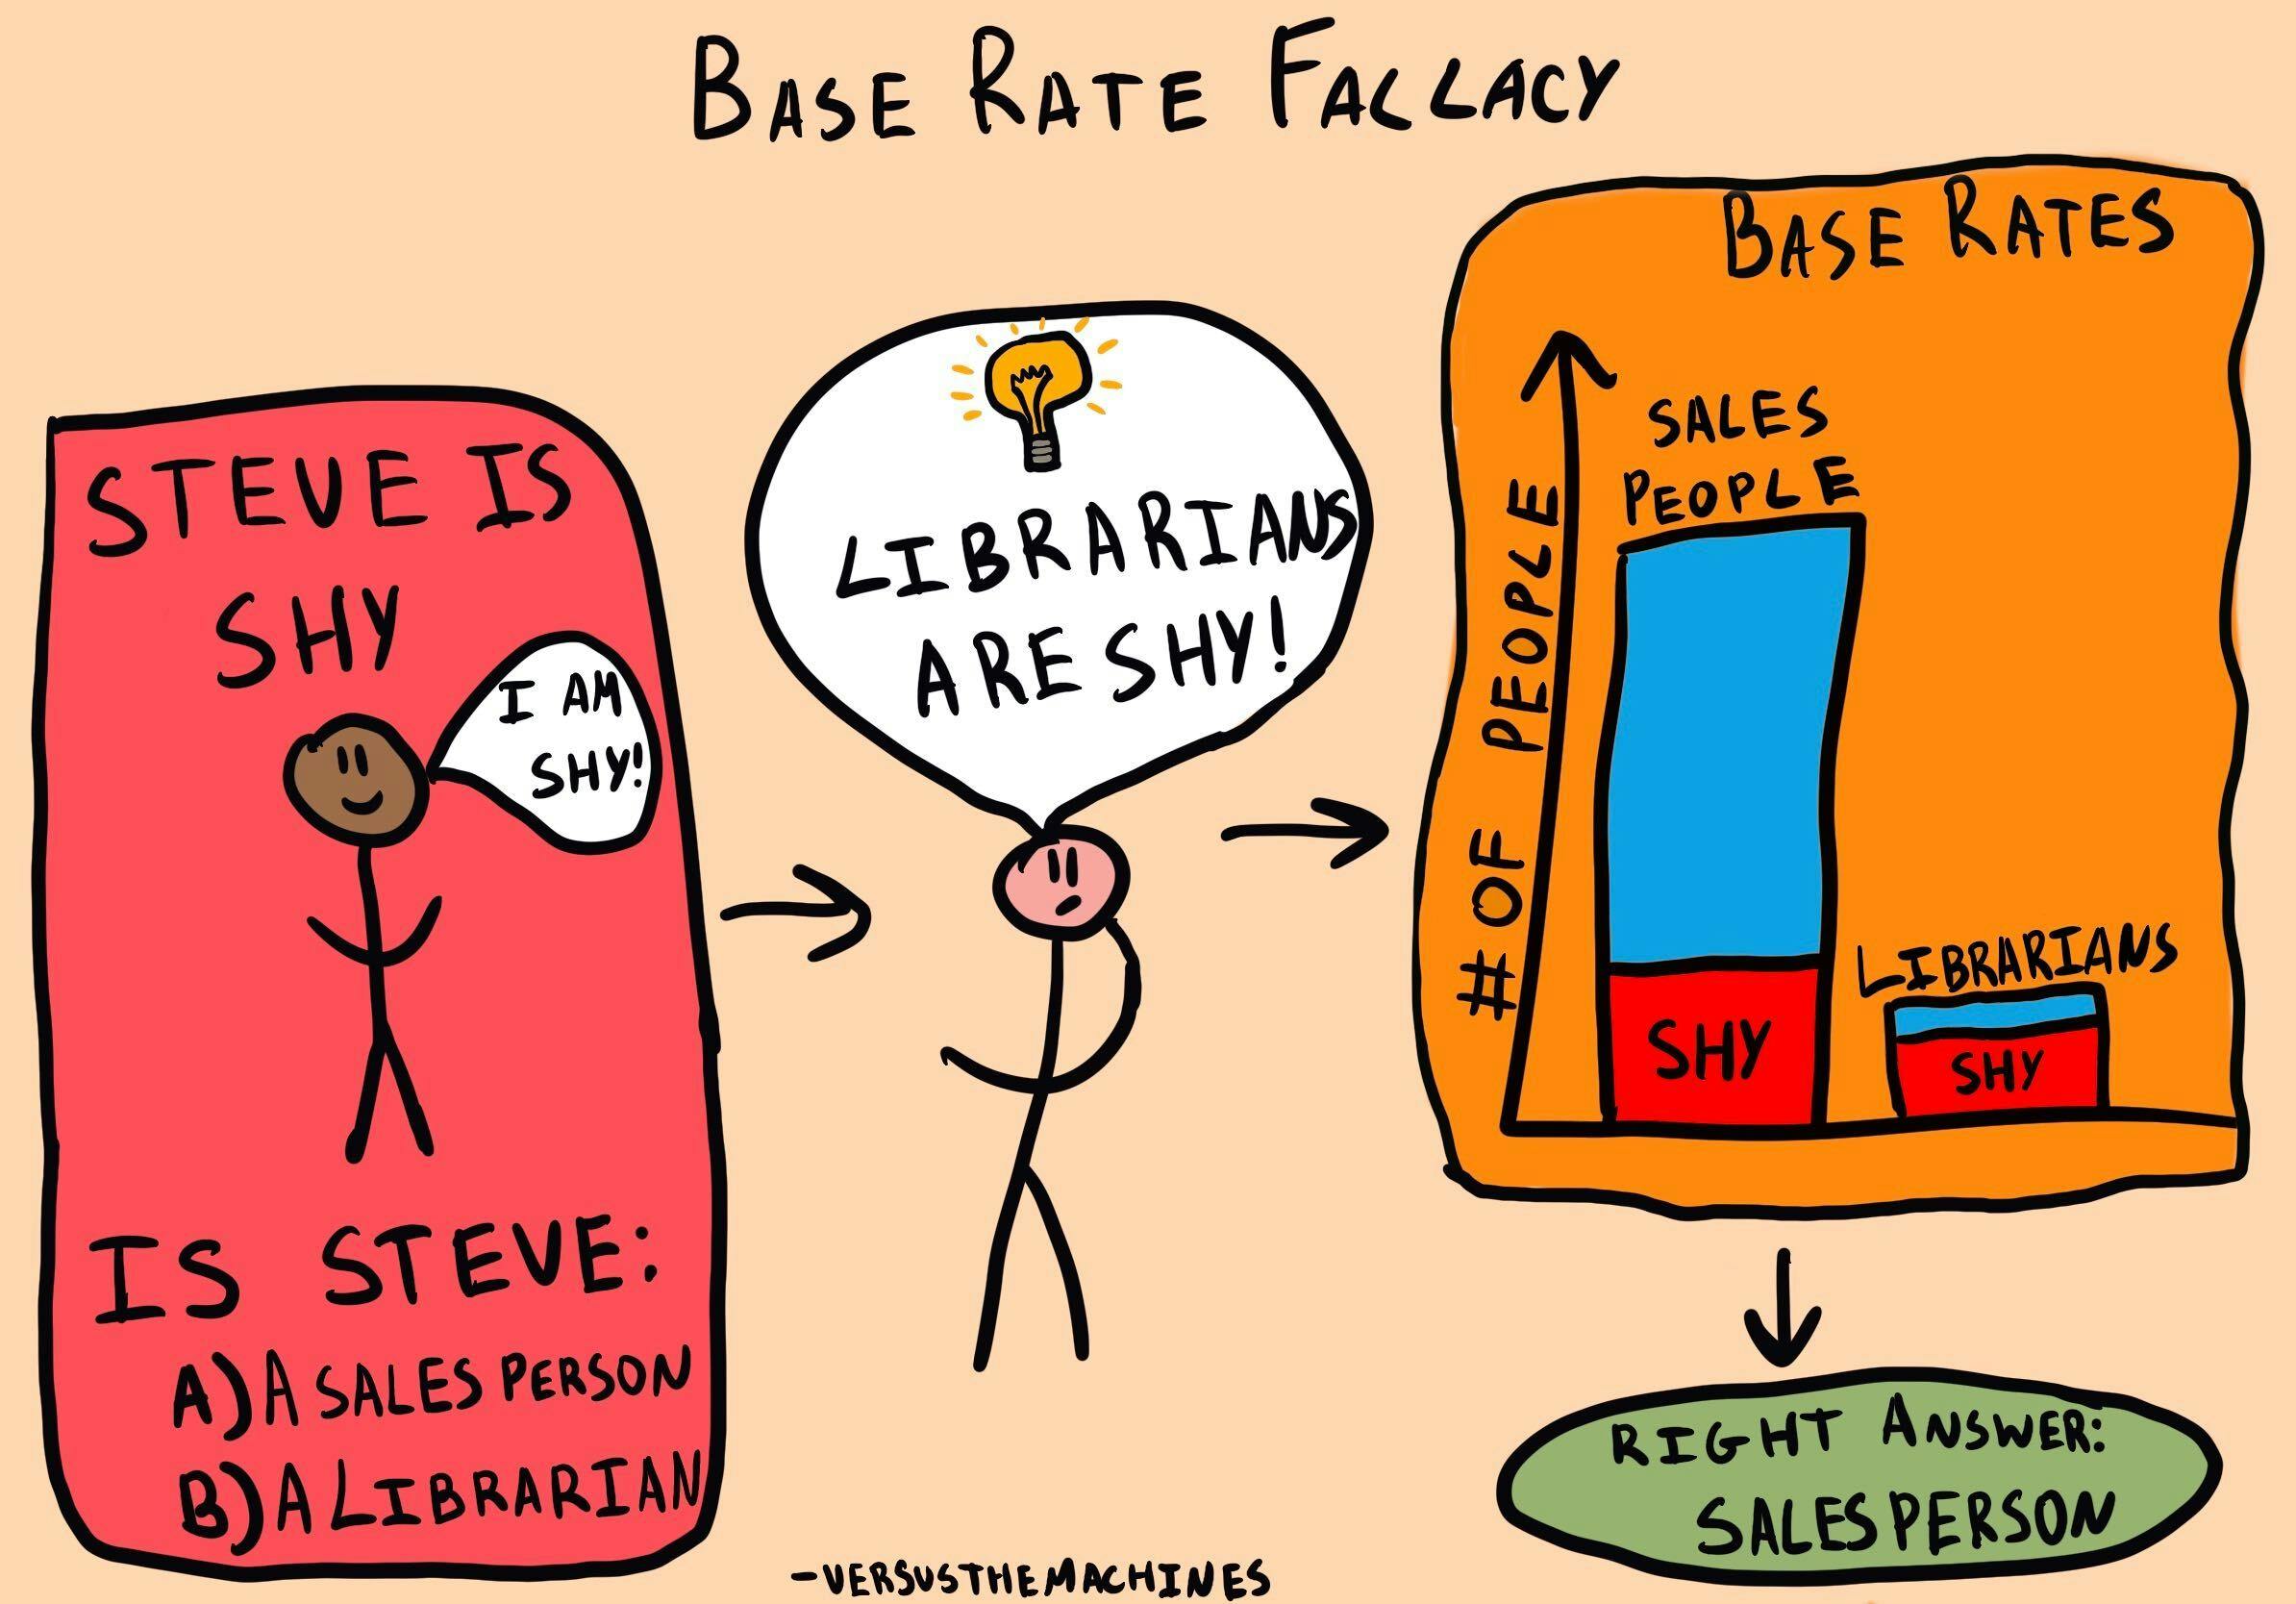
Our first topic is the Base Rate Fallacy. This is a common cognitive shortcut where people are swayed by specific, often vivid, information while completely ignoring general statistical truths, or "base rates." As a statistician, you know this as the error of ignoring the prior probability in a Bayesian inference. Your goal in this lesson is to deconstruct this error when it's used to cast doubt on personal choices and to counter it by reintroducing the statistical context that the fallacious argument deliberately ignores.
The Power of the Specific over the General
The Base Rate Fallacy preys on our tendency to be more compelled by a dramatic story than by dry statistics. A description of a single individual feels more real and relevant than data about a large, abstract group. The fallacy occurs when we mistake the probability of evidence given a hypothesis, , for the probability of the hypothesis given the evidence, .
A classic illustration of this is the "shy Steve" problem, popularized by psychologists Daniel Kahneman and Amos Tversky.
To see a brilliant mathematical and visual breakdown of this, the following video from 3Blue1Brown is invaluable. It walks through the "Steve" example and introduces the geometric intuition behind Bayes' theorem, the formal antidote to this fallacy.
Bayes theorem, the geometry of changing beliefs
This video, "Bayes theorem, the geometry of changing beliefs," provides a clear, intuitive explanation of the Base Rate Fallacy and the Bayesian reasoning that corrects it.
Watch the introduction to the Steve example, which perfectly sets up the conflict between stereotypical descriptions and base rates. Pay close attention to the section explaining how to incorporate the base rate to arrive at the correct probability. The mantra here is key: "new evidence should update prior beliefs," not replace them. Finally, observe how this reasoning is formalized into Bayes' theorem. As a statistician, you'll recognize the terms: prior, likelihood, and posterior. The video elegantly explains how they fit together.
As the video demonstrates, the core mistake is focusing on the "likelihood" (e.g., how likely a librarian is to be shy) while ignoring the "prior" (the overall number of librarians). To make a sound judgment, you must combine them.
For a more rigorous academic perspective, the classic paper by Maya Bar-Hillel, "The Base-Rate Fallacy in Probability Judgments," explores the psychology behind why we commit this error.
[PDF] The Base-Rate Fallacy in Probability Judgments - DTIC
This paper provides the foundational research on this topic. It will deepen your understanding of why this fallacy is so pervasive and psychologically compelling.
Start with the Summary on the first page. Note the core conclusion: base rates are ignored because people feel they are irrelevant. Next, read section 1.1, "The Base-Rate Fallacy: Examples and Implications." Focus on the famous Cab Problem. The subsequent calculation shows how intuitive judgment (around 80%) is wildly different from the correct Bayesian probability (41%). This highlights the magnitude of the error. Finally, read section 2.5, "Why are Base Rates Ignored?" This is the crucial part for crafting rebuttals. The author suggests that case-specific information is judged as more relevant, and that information with a perceived causal link dominates. This explains why a juicy detail about a person's behavior will almost always outweigh abstract population statistics in a casual argument.
The takeaway is that people are not just bad at calculation; they actively discard base rate information because it feels less specific and less causally relevant than the "indicator" evidence being presented.

Application 1: Judging Fashion Choices
Scenario: You are wearing a stylish, low-cut outfit that you designed. A judgmental acquaintance remarks, "You know, I read that women who are promiscuous are four times more likely to wear revealing clothes than women who aren't. You should be careful about the signals you're sending."
-
Fallacy Deconstruction:
- The Indicator: "Promiscuous women are 4x more likely to wear revealing clothes." This is the specific, diagnostic information. Let's call the likelihood. The critic presents a likelihood ratio of 4.
- The Ignored Base Rate: What is the actual base rate of "promiscuity" (however they define it) in the population? It's a small minority. Let's assume, for argument's sake, that 2% of women meet this person's definition, meaning 98% do not. This is the prior probability they are ignoring.
- The Flaw: They are using a statement about the habits of a small group to make a judgment about a member of the vast majority. Even if their "fact" is true, the number of women in the 98% who wear revealing clothes for reasons of style, confidence, or comfort will vastly outnumber those in the 2% group. They are mistaking a likelihood for a posterior probability.
-
Witty, Sharp Rebuttal (Leveraging your statistical background):
"That's a textbook Base Rate Fallacy. You're giving me a likelihood ratio but conveniently ignoring the prior probability. Let's run the numbers. Assume your 4-to-1 ratio is correct. Now, what's the base rate of women you'd consider 'promiscuous'? Let's be generous and say 5%. That means 95% aren't. In a group of 1000 women, that's 50 in your group and 950 in the other. If 'non-promiscuous' women wear revealing clothes at some rate 'x', your group wears them at '4x'. The total number of women in revealing clothes is , which is . The proportion of those who are 'promiscuous' is , which is only about 17%. So, based on your own logic, there's still an 83% chance you're wrong. Do you want to rethink your conclusion?"- Why it works: You don't just name the fallacy; you dismantle it using their own numbers, demonstrating their conclusion doesn't follow from their premise. By walking through the math (even simplified), you seize complete intellectual control, showing that their 'insight' is statistically illiterate. This is a sharp, analytical shutdown.
Application 2: Judging an Open Relationship Dynamic
Scenario: You mention that your wife, who is in an "open vee" relationship with you and another partner, is having a wonderful time on a weekend trip with her lover. A friend says, "Be careful. A survey of therapists found that in 80% of couples where non-monogamy leads to divorce, the cause was an external relationship getting 'too serious.' This sounds like a huge red flag."
-
Fallacy Deconstruction:
- The Indicator: "In 80% of divorces caused by non-monogamy, a serious external affair was the reason." This is specific information about a subset of a subset (couples who divorce because of non-monogamy). It's a statement about .
- The Ignored Base Rate: What is the actual success rate (i.e., non-divorce rate) of consensual, communicative non-monogamous relationships? The critic is assuming your relationship is in the "doomed to failure" category. The relevant base rate is the overall stability and happiness within such relationships, which they are ignoring.
- The Flaw: The friend is taking a statistic about why failures happen and treating it as a predictor of whether failure will happen. This is a classic base rate neglect. The vast majority of experiences in consensual non-monogamy (weekend trips, dates, ongoing relationships) do not end in divorce. Focusing only on the characteristics of the tiny fraction that do is deeply misleading.
-
Witty, Sharp Rebuttal:
"You're making a rookie statistical error: confusing a property of the failed set with the probability of entering that set. It's like saying because 80% of fatal falls involve hitting your head, seeing someone trip is a 'huge red flag' for death. You're ignoring the base rate—the millions of people who trip and just get back up. The relevant statistic isn't the attributes of failure, but the probability of failure. And in well-managed open relationships, that's surprisingly low."- Why it works: The analogy (tripping vs. fatal falls) is sharp, intuitive, and perfectly maps onto the statistical error. It reframes their "concern" as alarmist and illogical. It counters their specific data point by pointing to the larger, more relevant (and unstated) dataset, thereby exposing the fallacy.
Key Takeaways for Countering the Fallacy
- The Flaw: The Base Rate Fallacy occurs when someone ignores the general frequency of an event (the base rate or prior) and focuses instead on specific, descriptive information (the indicator or likelihood).
- The Psychological Trap: We are wired to prefer specific stories over general statistics. The fallacy works by making the indicator seem more relevant and causal than the "mere statistics" of the base rate.
- The Counter: Your primary tool is to reintroduce the ignored base rate.
- Ask "Out of How Many?": Force the conversation back to the denominator. This shifts the frame from percentages to concrete frequencies, which people intuitively understand better.
- Name the Fallacy: Using the term "Base Rate Fallacy" or "base rate neglect" signals that you recognize the specific logical error they are making.
- Run the Numbers: As a statistician, this is your superpower. By quickly and confidently sketching out the Bayesian logic (even with rough numbers), you can demonstrate that their conclusion is not supported by their own evidence.
In our next lesson, we will continue our exploration of probabilistic errors by examining the Conjunction Fallacy, a fascinating bias where people mistakenly believe that two events happening together are more probable than one of those events happening alone.