Hello and welcome back.
In the last lesson, you implemented the consume command for our CLI, successfully closing the loop on our message broker's core functionality. You now have a complete end-to-end system where messages can be produced by one client and streamed to another via the broker. This is a massive achievement.
With a working system, our focus now shifts to making it observable. How do we know what's happening inside the broker? Is it healthy? How many messages is it processing? To answer these questions, we need to instrument it.
Today's learning outcome is to integrate the Prometheus client library to expose a /metrics HTTP endpoint on the broker. This is the foundational step in turning our black-box server into a transparent, monitorable service.
1. What is Monitoring with Prometheus?
Prometheus is an open-source systems monitoring and alerting toolkit that has become the de-facto standard in the cloud-native world. It operates on a pull-based model. This means your application doesn't push metrics to a central location; instead, it exposes them on an HTTP endpoint (typically /metrics), and a Prometheus server periodically scrapes (fetches) them.
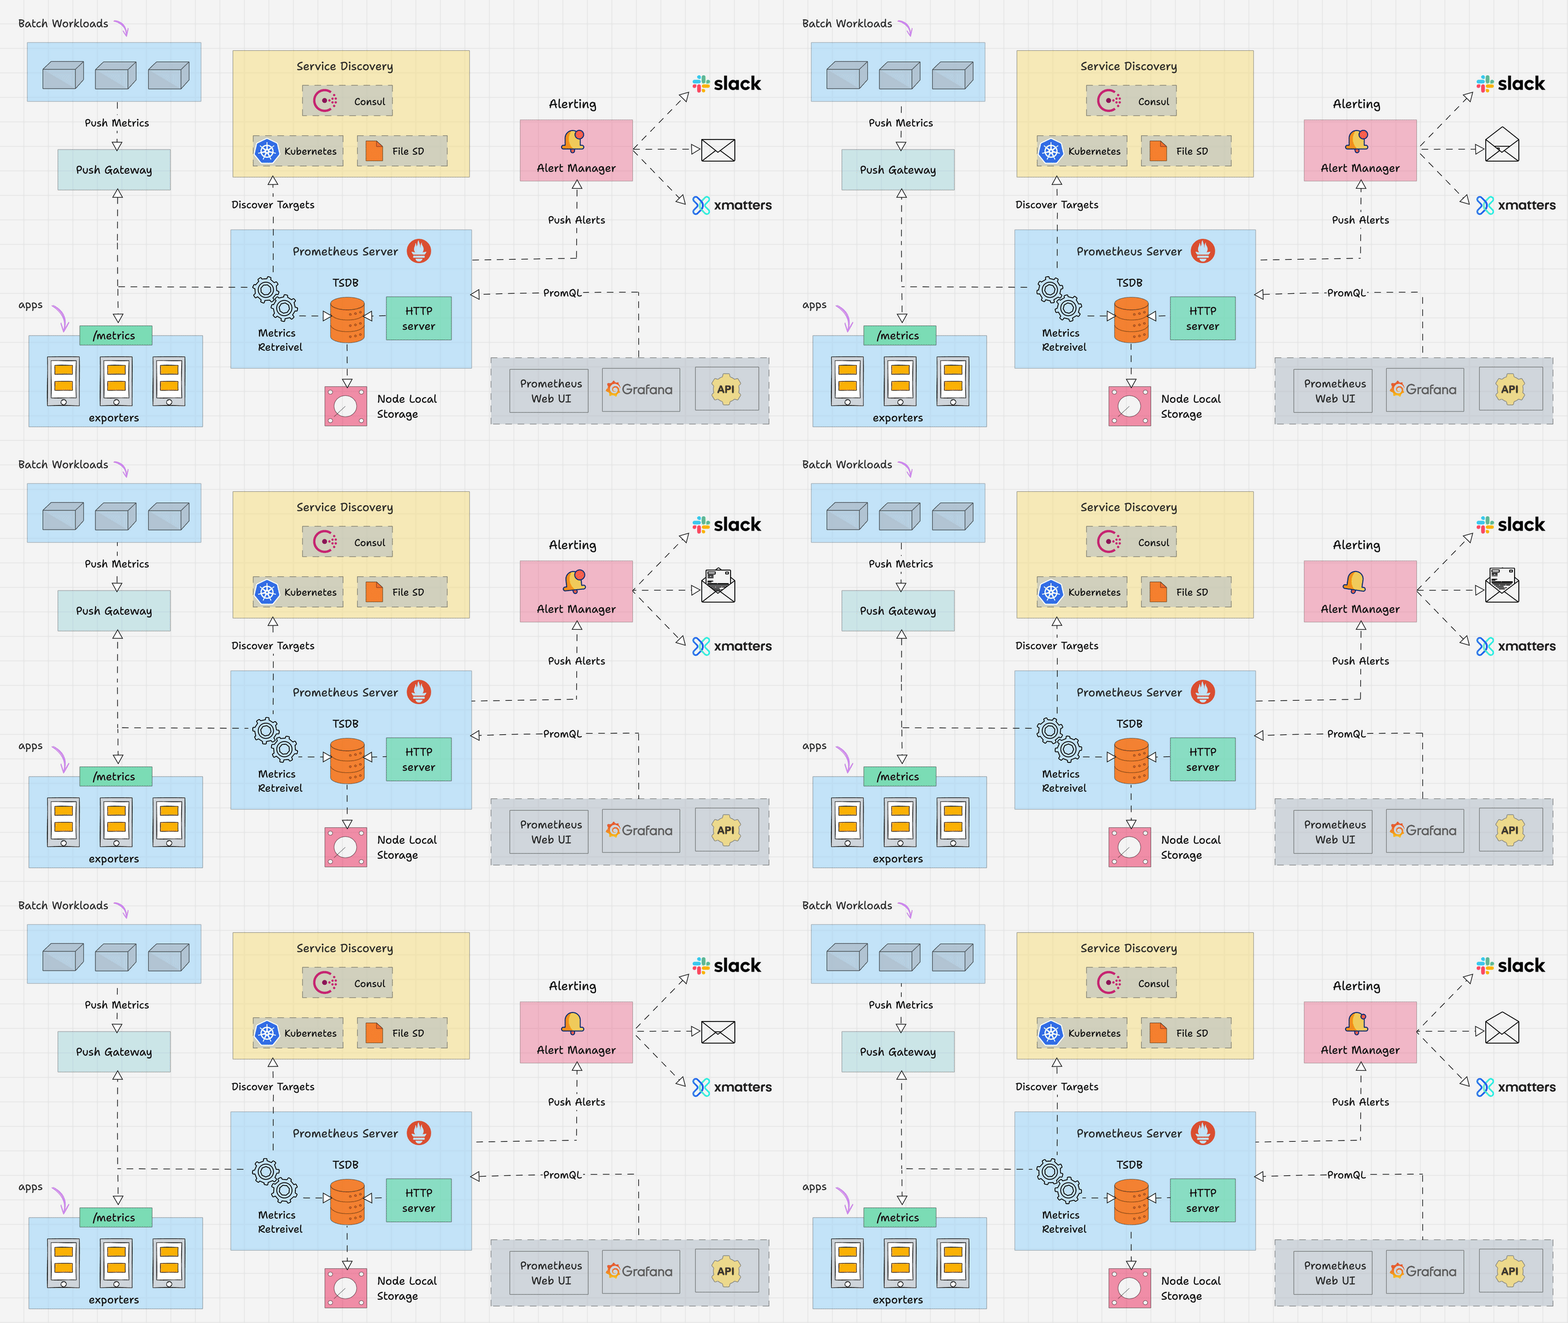
Our goal today is to implement that /metrics endpoint on our broker.
2. Adding the Prometheus Client Library
First, we need to add the official Go client library for Prometheus to our broker's dependencies. Navigate to your broker's root directory in your terminal and run the following commands:
go get github.com/prometheus/client_golang/prometheus
go get github.com/prometheus/client_golang/prometheus/promhttp
prometheus: The core package for creating and registering metrics.promhttp: A helper package that provides an HTTPHandlerto expose metrics in the format Prometheus expects.
3. Exposing the /metrics Endpoint
Here we face an interesting system design challenge. Our broker currently listens for TCP connections for its messaging protocol. The Prometheus endpoint, however, must be served over HTTP. This means our single application needs to run two network servers concurrently on different ports:
- Our existing TCP server for the broker's primary function (e.g., on port
9092). - A new HTTP server for the
/metricsendpoint (e.g., on port9091).
Running the metrics server on a separate port is a standard practice. It allows you to configure network access (e.g., firewall rules) for the metrics endpoint independently from your main application traffic.
We will achieve this by starting the HTTP server in a new goroutine before our main function begins its primary work of managing the TCP listener.
Let's modify the broker's main.go file.
-
Add the necessary imports:
import ( // ... your existing imports "log" "net/http" "github.com/prometheus/client_golang/prometheus/promhttp" ) -
Create a function to start the metrics server. This function will set up the
/metricshandler and start listening on a dedicated port. It's designed to be run as a goroutine.// Add this function to your broker's main.go func startMetricsServer(addr string) { mux := http.NewServeMux() // The promhttp.Handler() function provides a default handler // to expose the metrics. mux.Handle("/metrics", promhttp.Handler()) log.Printf("Metrics server listening on %s", addr) if err := http.ListenAndServe(addr, mux); err != nil { log.Fatalf("Failed to start metrics server: %v", err) } } -
Launch the metrics server from your
mainfunction. You'll start it as a goroutine right at the beginning ofmain.// Inside your main() function in the broker func main() { // ... your existing setup code ... // Start the metrics server in a background goroutine go startMetricsServer("localhost:9091") // ... the rest of your main function that starts the TCP server ... // For example: // listener, err := net.Listen("tcp", "localhost:9092") // ... and so on }
This pattern of running multiple servers is common in Go applications. The following video explains the rationale and demonstrates how to run multiple HTTP servers, which is conceptually identical to our use case of running one TCP and one HTTP server.
How to Monitor/Instrument Golang with Prometheus (Counter - Gauge - Histogram - Summary)
This video explains why running a separate server for metrics is a good practice and demonstrates how to run multiple servers using goroutines. The principle shown is exactly what we are applying.
Watch from 08:01 to 09:20. Focus on the pattern of creating a separate request multiplexer (ServeMux), launching http.ListenAndServe in a goroutine for the secondary server, and letting the main function block on the primary server or another mechanism.
4. Verification
Now, let's see it in action.
- Run your broker application. You should see the log message "Metrics server listening on localhost:9091" in addition to your broker's usual startup logs.
- In a separate terminal, use
curlto scrape the endpoint:
curl http://localhost:9091/metrics
You will see a text-based output containing many lines of metrics.
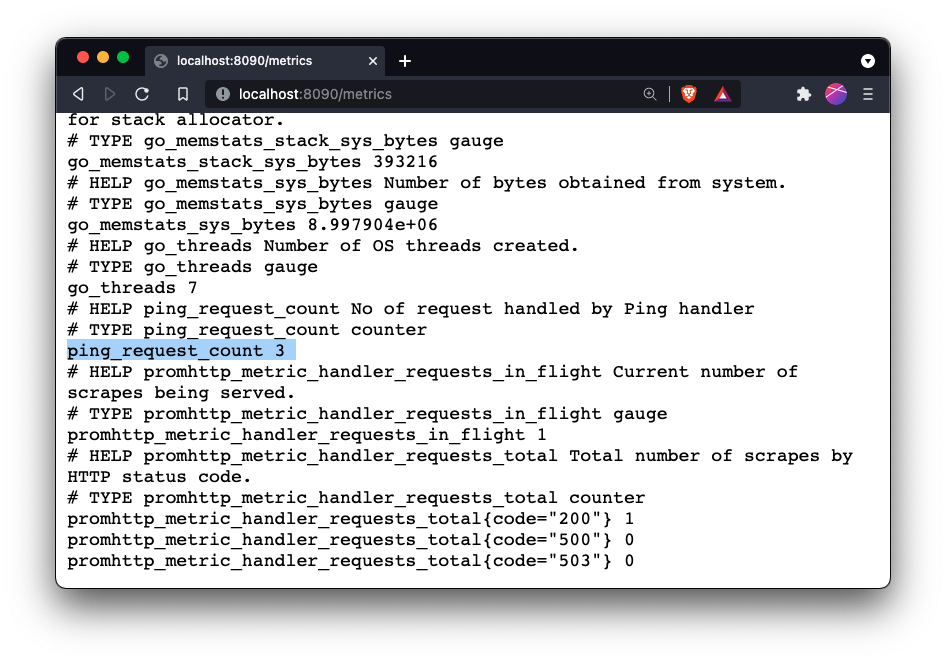
What are all these metrics? The promhttp.Handler() uses a default global "registry" of metrics. By simply including the library, it automatically registers a number of standard metrics about the Go runtime itself, such as:
go_goroutines: The current number of goroutines.go_memstats_alloc_bytes: The current number of bytes allocated by the application.go_gc_duration_seconds: A summary of garbage collection pause durations.
These are incredibly useful for understanding the health and performance of your Go application at a low level, and we get them for free!
To solidify your understanding of this basic setup, the following resource provides a concise walkthrough.
How to Build a Prometheus Client in Go - OneUptime
The article 'How to Build a Prometheus Client in Go' provides a very clear and direct guide to the steps we just took.
Briefly review the 'Setting Up the Project' section to confirm the go get commands. Then, in the 'Creating the HTTP Server' section, focus on the lines http.Handle("/metrics", promhttp.Handler()) and http.ListenAndServe(). This reinforces the core logic we just implemented.
Conclusion
Congratulations! You have successfully instrumented your message broker and exposed a Prometheus-compatible /metrics endpoint. You've taken a critical step towards making the system production-ready by enabling observability into its internal state.
Key Takeaways:
- Prometheus Pull Model: You understand that your application's role is to expose metrics for a Prometheus server to scrape.
- Concurrent Servers in Go: You implemented a common and powerful pattern: running multiple network servers (TCP and HTTP) within a single Go application using goroutines.
- Default Runtime Metrics: You learned that the Go Prometheus client library provides a wealth of valuable metrics about the Go runtime out of the box.
Next Up
Right now, we are only exposing generic Go runtime metrics. While useful, they don't tell us anything specific about our broker's operations. In the next lesson, we will build on today's foundation to implement Prometheus counters and gauges to track message rates, active connections, and consumer lag. This is where we'll start generating the data that truly matters for monitoring our message broker.