Hello! Welcome to your next lesson on Advanced Cycle Analysis.
In our last session, we honed the skill of visually identifying different thermodynamic processes (isobaric, isochoric, etc.) on a P-V diagram. This is the first step in decoding any thermodynamic cycle. Today, we build directly on that foundation by moving from identification to qualitative analysis.
Our goal for this lesson is to determine the signs (+, -, or 0) of work (W), heat (Q), and internal energy change (ΔU) for each segment of a cycle, directly from its P-V diagram. This is a powerful technique for JEE Advanced, as it allows you to quickly reason about the energy flow in a system, often letting you eliminate incorrect options or double-check your calculations without extensive computation.
1. The First Law and Sign Conventions: A Clear Framework
The foundation for our analysis is the First Law of Thermodynamics. As you've noted, its representation can be a source of confusion. Let's tackle that head-on.
The law itself is a statement of energy conservation: the change in a system's internal energy (ΔU) is the net result of heat (Q) added to it and work (W) done on it. The ambiguity arises from the definition of 'W'.
- Physics/Engineering Convention: Focuses on the output of the system.
Wrepresents the work done by the system. For a gas expanding and pushing a piston, this work is considered positive. The first law is written as:
- Chemistry (IUPAC) Convention: Focuses on the energy changes of the system.
Wrepresents the work done on the system. If the surroundings compress a gas, work is done on it, and this is considered positive. The first law is written as:
Since , the two forms are physically identical. For JEE Physics, the first convention () is standard. We will use it exclusively to ensure consistency.
The following image provides a helpful visual summary for heat and work signs under this convention.
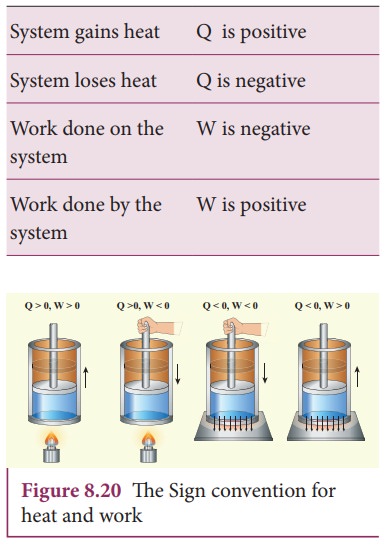
To solidify your understanding of why these different conventions exist and how to confidently translate between them, the following reading from Quora provides an excellent explanation.
Why is the sign convention just opposite in thermodynamics, physics ...
The following article, titled 'Why is the sign convention just opposite in thermodynamics, physics...', compiles several expert answers that clarify the historical and practical reasons for the different sign conventions. It directly addresses your concern about switching between them.
Please read the answers from the sections titled 'Sign conventions are different because both the subjects focus on different concept in the process', 'First law of thermodynamics which is expressed in two different ways depending on the discipline', and 'How to translate between conventions'. Focus on the core idea: physics is concerned with the 'output' (work done by the system), while chemistry is concerned with changes to the system itself. Pay close attention to the simple rule: W_{on} = -W_{by}.
2. A Systematic Approach to Determining Signs
With our sign convention firmly established as , we can now devise a simple, three-step "algorithm" to analyze any process on a P-V diagram.
Step 1: Sign of Work Done ()
Work done by the gas is given by . The sign can be determined instantly by looking at the change in volume (the x-axis).
- Expansion (): The arrow on the path points to the right. , so .
- Compression (): The arrow on the path points to the left. , so .
- Isochoric Process (): The path is a vertical line. , so .
Step 2: Sign of Internal Energy Change ()
For an ideal gas, internal energy is a function of temperature only: . So, the sign of is the same as the sign of . To find the sign of from a P-V diagram, we use the ideal gas law, .
This means . We can visualize this using isotherms (curves of constant temperature, ).
- Temperature Increases: The process path moves from a lower isotherm to a higher one (i.e., the product increases). , so .
- Temperature Decreases: The path moves from a higher isotherm to a lower one (the product decreases). , so .
- Isothermal Process: The path stays on a single isotherm. , so .
Step 3: Sign of Heat Transferred ()
Once we know the signs of and , we use the first law, rearranged as , to find the sign of .
- If and are both positive, must be positive (heat is absorbed).
- If and are both negative, must be negative (heat is rejected).
- If and have opposite signs, the sign of is ambiguous without knowing the magnitudes. For example, in an expansion () where the gas cools down (), heat could be absorbed, rejected, or zero depending on whether the energy lost from cooling is more or less than the energy spent on work. This is a key insight for advanced problems.
3. Application: Solving a JEE Advanced Problem
Let's apply this three-step method to a real JEE Advanced problem. The following video analyzes a rectangular cycle. Before watching the explanation, try to apply our algorithm yourself.
JEE Advanced Physics 2021 Shift 1 #2 Thermodynamic Cyclic Process
The following video by Michel van Biezen tackles a JEE Advanced 2021 problem that asks in which steps of a cycle heat is absorbed. This is a perfect test of our qualitative analysis skills. I want you to first analyze the cycle yourself using our three-step method and then watch the video to see the expert solution.
First, look at the rectangular P-V diagram shown in the video's thumbnail (and at the start of the video). For each of the four steps (1, 2, 3, and 4), determine the signs of W_{ ext{by}}, \Delta U, and Q. Write them down. Then, watch the video from the beginning to 06:07 to check your reasoning against the presented solution. The video uses the same sign convention we are using.
Let's summarize the analysis from the video to confirm the process:
- Step 4 (Isochoric Heating):
- (vertical line).
- (moving up to a higher P at constant V, so increases).
- . Heat is absorbed.
- Step 1 (Isobaric Expansion):
- (moving right).
- (moving to a higher V at constant P, so increases).
- . Heat is absorbed.
- Step 2 (Isochoric Cooling):
- (vertical line).
- (moving down to a lower P at constant V, so decreases).
- . Heat is rejected.
- Step 3 (Isobaric Compression - not shown in video but for completeness):
- (moving left).
- (moving to a lower V at constant P, so decreases).
- . Heat is rejected.
The video correctly concludes that heat is absorbed in steps 1 and 4.
4. From Qualitative Signs to Quantitative Verification
To connect this qualitative skill to the quantitative problem-solving you enjoy, let's analyze another cycle. First, predict the signs, and then watch a video where the exact values are calculated.
The cycle is A → B → C → A as shown in the diagram at the beginning of the next video.
PV-Diagram Ideal Gas Cycle: Calculate Heat, Work, Change in Internal Energy, and Efficiency
This video from Physics Ninja provides a full quantitative analysis of a triangular cycle. This is a great opportunity to test your sign-prediction skills and then see them confirmed by calculation.
Pause the video at the start (around 0:01:08) to see the P-V diagram. Apply our three-step algorithm to predict the signs of W_{ ext{by}}, \Delta U, and Q for the three processes: A→B (isobaric), B→C (isochoric), and C→A (linear). Then, watch the video from 01:08 to 13:13 to see the detailed calculations. Compare the signs of the final numerical answers with your predictions.
This exercise should give you confidence that your graphical intuition is a reliable and fast way to understand the physics of a cycle before diving into the numbers.
Test your understanding!
Consider a cyclic process A→B→C→A for one mole of an ideal gas on a P-V diagram.
- A→B is an isochoric process where pressure increases.
- B→C is an isobaric process where volume increases.
- C→A is a process that returns the gas to the initial state, where both P and V decrease.
Complete the following table with the signs (+, -, 0) for , , and for each path.
| Process | |||
|---|---|---|---|
| A → B | |||
| B → C | |||
| C → A |
Show answer
Here is the completed table with reasoning:
| Process | |||
|---|---|---|---|
| A → B | 0 | + | + |
| B → C | + | + | + |
| C → A | - | - | - |
Reasoning:
- A → B (Isochoric Heating):
- because .
- Pressure increases at constant volume, so increases, meaning and .
- .
- B → C (Isobaric Expansion):
- Volume increases, so .
- Volume increases at constant pressure, so increases, meaning and .
- .
- C → A (Compression and Cooling):
- The final volume is less than the initial volume, so the net work done during this path is negative. .
- The process returns to state A, which has a lower product than state C. Therefore, the temperature must decrease, and . (Note: ).
- .
Conclusion
You have now developed a powerful, systematic method for extracting crucial physical information from a P-V diagram without performing a single calculation. This is precisely the kind of conceptual mastery that separates strong JEE Main performance from success in JEE Advanced.
Key Takeaways:
- The signs of , , and can be determined systematically from a P-V diagram.
- Sign of : Determined by the direction of volume change (right is +, left is -, vertical is 0).
- Sign of : Determined by the change in temperature, which is proportional to the change in the product . Moving to a higher isotherm means .
- Sign of : Determined by applying the First Law, , after finding the signs of the other two quantities.
- For a complete clockwise cycle on a P-V diagram, the net work done by the system is positive. For an anticlockwise cycle, it's negative.
Preview of the Next Lesson:
With the ability to identify processes and determine the signs of energy transfers, we are now ready to tackle the quantitative side. In the next lesson, we will focus on how to calculate the changes in state variables (P, V, T) across each step of a multi-process path on a P-V diagram. This involves using the ideal gas law and the specific process equations (e.g., for an isotherm) to find the coordinates of each vertex in the cycle, paving the way for complete cycle analysis.